Download
1 / 39
390 likes | 1.06k Vues
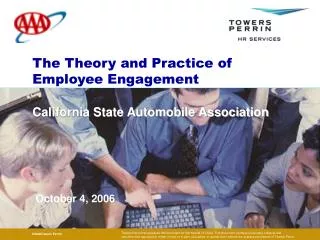
The Theory and Practice of Employee Engagement. California State Automobile Association. October 4, 2006. ©2006Towers Perrin.

E N D
The Theory and Practice of Employee Engagement California State Automobile Association Presenter's Name October 4, 2006 ©2006Towers Perrin Towers Perrin has prepared this document for the benefit of CSAA. This document contains proprietary material and should not be reproduced, either in total or in part, circulated, or quoted from without the express permission of Towers Perrin.
Topics for Discussion • Background – Engagement at CSAA • Who we are • Why the interest in engagement • Results from our surveys • ROI – Context for engagement ROI analysis • What Towers Perrin’s research shows • What other organizations have found • How (and why) CSAA analyzed the ROI of engagement • Background • Data Collected and Analysis Performed • Findings • Key relationships • ROI/financial Implications • Actions taken and lessons learned
California State Automobile Association (CSAA) • AAA was established in 1900 and offers an array of automotive, insurance, travel and financial services. • AAA is a not-for-profit, tax-paying federation of 77 motor clubs with more than 1,100 offices, serving 46 million members throughout the United States and Canada. • CSAA (AAA of Northern California, Nevada and Utah) serves more than four million members and is the second-largest member organization of the national AAA organization. • We have almost 7,000 employees working out of more than 125 locations across five states. • CSAA is headquartered in San Francisco.
CSAA’s 2006 Employee Engagement Survey • The 2006 Employee Engagement Survey was designed to meet the following key objectives: • Learn how employees view the organization overall and understand how they feel about their experiences in specific work groups • Understand employee perspectives regarding CSAA’s business effectiveness and the organization as a place to work • Assess how well the organization is delivering on its vision, values and behaviors from an employee perspective • Identify any important differences of opinion across CSAA • The survey was administered from December 5 through December 16, 2005 (with paper surveys accepted through December 20) • Of the 6,762 employees invited, 4,325 completed the survey – this response (64%) is a strong response rate for an employee engagement survey* *The prior year’s employee engagement survey produced the same response rate of 64%, or 4,090 respondents out of 6,400 employees invited to take the survey
CSAA’s 2006 Employee Engagement Survey • Six questions form an engagement index that is: • Consistent with Towers Perrin’s research on employee engagement • Statistically reliable (the items form a cohesive index) • The engagement index includes the following questions: 1. I would recommend CSAA to a friend as a good place to work. 2. I am proud to tell others I work for CSAA. 3. My job provides me with a sense of personal accomplishment. 4. I am willing to put in a great deal of effort beyond what is normally expected to help CSAA succeed. 5. I understand how my role in CSAA is related to CSAA's overall goals, objectives and direction. 6. I understand how my unit/department contributes to the success of CSAA.
In the 2005 survey, CSAA’s scores were above Towers Perrin’s normative benchmarks on the employee engagement index This year, CSAA’s engagement index score was similar to last year’s -- and still notably higher than Towers Perrin norms Diff. from Norm +7% +7%
CSAA’s diversity index score is also above the comparable index figure for last year • Six questions form a diversity index that CSAA has identified as the best survey measure regarding diversity and is statistically reliable. • The diversity index includes the following questions: 1. How would you rate your immediate supervisor/manager on: Consulting employees before making decisions that affect them 2. How would you rate your immediate supervisor/manager on: Acting in ways that support a diverse and inclusive environment 3. I can be myself around here. 4. It’s safe to say what you think around here. 5. At CSAA, employee input and different opinions are actively encouraged. 6. Employees at CSAA are able to contribute to their fullest potential regardless of their age, race, ethnic background, gender, religion, disability, sexual orientation, or family status. Diff.from 2005 +3% Diff. from Norm N/A
CSAA’s empowerment index score is also above the comparable index score from 2005 • The empowerment index includes the following questions: 1. How would you rate your immediate supervisor/manager on: Encouraging/empowering people to take initiative in their work 2. CSAA empowers employees to make appropriate decisions that are in the best interests of the company and customers. 3. CSAA provides me with opportunities to learn new skills and develop myself. 4. I have the appropriate amount of decision-making authority to do my job well. 5. At CSAA, employees are supported in taking appropriate work-related risks. Diff.from 2005 +5% Diff. from Norm N/A
. . . And we have many opportunities for improvement Engagement surveys point out these key areas for improvement: • I have excellent career opportunities at CSAA -- 55% favorable • CSAA’s senior management acts in ways that are consistent with what they say -- 47% favorable • Managers consult employees before making decisions that affect them -- 54% favorable • CSAA cares as much for employees as for members -- 41% favorable
Results by Survey Category • Employee views are generally positive, with views regarding senior management receiving the lowest scores (as they did in last year’s survey) • Scores in all categories either rose slightly or stayed the same as last year Diff.from 2005 0% 1% 0% 2% 0% 2% 1% Note: Totals may not add to 100% due to rounding
CSAA conducted a culture scan to give us even more information • Background: CSAA’s territory is extremely diverse. In general, our employees reflect that diversity – except at the senior level. • Goal of culture scan: To understand what basic beliefs drive organizational practices and behaviors and how those beliefs impact the ability of CSAA to leverage diversity • Components of scan: Interviews, focus groups, analysis of employee engagement survey, historical review
CSAA conducted a culture scan to give us even more information (cont’d) • Findings: • Strategic -- AAA brand is key to our success • Governance – Service-driven family • Operational -- Individual effort • Critical targets for leveraging diversity: • Fear of retaliation • Reluctance to speak up • Requirements for fitting in • Business case for diversity Results were consistent with engagement survey findings, withno significant differences based on ethnicity or gender.
= Global response Towers Perrin’s Global Workforce Study reinforces why engagement matters: Highly engaged employees believe they contribute directly to results I can positively impact quality 31% Disengaged 62% Moderately engaged 84% Highly engaged I can positively impact cost 19% Disengaged 42% Moderately engaged 68% Highly engaged I can positively impact customer service 27% Disengaged 50% Moderately engaged 72% Highly engaged
The National Bank of Canada found strong relationships among employee engagement, client satisfaction and shareholder returns
Sears developed its employee-customer-profit chain to help in the turnaround of the mid-1990s 5 unit increase in employee attitude 1.3 unit increase in customer impression .5% increase in revenue growth
Towers Perrin’s work with a major hospitality company elaborated on the relationships among employee behaviors, customer loyalty and financial results Reduced Turnover Cost Team Member Attitudes and Behaviors Key Drivers Q10: Overall job satisfaction Q15: Encouraged to identify problems Q19: Hotel retains top performers Q20: Team members are kept informed Q33: Proud to work for hotel Q54: Vision - ‘Investing in the development of team members’ Q55: Vision - ‘Delivering innovative products/services’ Q56: Vision - ‘Improving hotel perf. through the BC’ Q57: Vision - ‘Family of brand awareness’ Q60: Hotel’s image Q63: Balanced Scorecard drives decisions Q69: Hotel management balances short-/long-term considerations Q70: Members of the Executive Committee cooperate well together Q72: Hotel has high standards for business ethics Commitment/ Loyalty Index Q1 Hotel as a place to work Q58 Overall satisfaction w/hotel Q59 Willingness to recommend to a friend Customer Outcomes Financial Outcomes Customer Loyalty RevPar Index EBITDA / GOP Margin Guest Service Index Q4 High quality service Q5 Courteous team members Q6 Sensitive to guest needs Q7 Solving guest problems Q8 Meeting expectations consistently/timely Q9 Providing a safe place • Brand A: 5 percentage point change in team member attitudes/behaviors > +1.6 percentage points in EBITDA • Brand B: 5 percentage point change in team member attitudes/ behaviors > + 2.1 percentage points in GOP margin
Becker, Huselid and Ulrich found a relationship between HR systems and firms’ market value per employee
The Lay of the Land • CSAA leadership realizes that employee engagement is important but that the ROI is difficult to quantify • If the ROI can’t be quantified, it’s difficult to justify requests for resources to improve engagement • But without a resource investment, engagement isn’t likely to increase • And the (difficult to quantify but nevertheless real) benefits of engagement won’t be realized • Hence the challenge: • Figure out where and how engagement really matters in a business sense • Determine which investments in building engagement are likely to produce the highest ROI • Define the investment strategy • Track the ROI produced by increased engagement, partly as proof and partly to direct future investment
Our analysis focused on determining the strength and the financial implications of relationships between: • Employee engagement and perceived customer service focus • Engagement and financial outcomes • Engagement and employee turnover • Turnover and financial outcomes • Engagement, perceived customer focus and other operational results
With this as backdrop, we undertook a six-step process • Project planning and kickoff – Launched the project by confirming goals and desired results of the effort • Compiled current CSAA data – Obtained financial, customer satisfaction measurement and HR data to analyze for linkage relationships • Developed value driver models – Identified statistical relationships between engagement and operational outcomes • Mapped employee behavior/attitude elements to customer behavior elements – We delved further into engagement data to understand the nuances of engagement at CSAA • Defined overall investment strategy – We completed the project by recommending a directional investment strategy for improving engagement and the financial outcomes it influences; focus for CSAA: - Leadership development - Creating a diverse and inclusive environment - Hiring, promotion and talent management processes and policies • Executed – Check for progress (pulse surveys)
We conducted a range of analyses using both Towers Perrin and CSAA data • Using the Towers Perrin Global Workforce Study (GWS) database, we analyzed the relationship between employee engagement and combined ratio for a population of 16 insurance companies • Using these data we developed a structural equation model • We applied this model to CSAA insurance product data • We also performed a series of analyses on the CSAA Employee Engagement Survey data (supplemented by analysis of the engagement findings from our GWS database) to deepen our understanding of engagement drivers • We collected and analyzed a variety of other CSAA data: • Financial data for each product area • Comprehensive file of human resource data • Performance and customer satisfaction metrics from all of CSAA's businesses
To understand the financial value of engagement in CSAA’s insurance business, we examined data on the financial value of engagement in the insurance industry • For this analysis, we integrated two sources of data: • 2005 financial data from AM Best (combined ratio, loss ratio, expense ratio, net premiums written (NPW) growth rate) for US insurance companies* • 2005 engagement and customer satisfaction** data from Towers Perrin’s Global Workforce Study for the same insurance companies • We looked at relationship among engagement, customer satisfaction and the financial measures across companies • Based on the nature of the measures, we would expect: • Negative relationships between engagement/customer satisfaction and combined ratio, loss ratio, and expense ratio (since lower numbers mean better performance for the these ratios) • Positive relationships between engagement/customer satisfaction and NPW growth *23 top U.S. writers with at least $1 billion in DPW and approximately 60% or more of writings in personal auto and homeowners. Most of the companies do not pay a dividend, so combined ratio without dividend was used in the analysis. **Customer satisfaction data is based on employee perceptions.
The Bottom Line: • For CSAA overall, a 5% increase in engagement is associated with a possible financial gain of $47.4 million, comprising: • $44.2 million in the insurance product area (net underwriting gain) • $3.2 million in membership and travel (operating income) • Improving engagement also has implications for turnover cost: • A 1% improvement in key turnover drivers is associated with potential cost savings from $185,000 (if the cost of each termination is 50% of annual pay) to $554,000 (if each termination costs 1.5 times annual pay) • These cost reductions are embedded within the broader financial calculations for improved engagement • Engagement is not a stand-alone activity. Relationships are not guaranteed but the direction is clear. It is also a powerful way to galvanize leadership commitment to employee issues.
The relative strength of engagement drivers suggests targets for HR investment • Ten questions account for 67% of the variance in engagement • Key items have a much stronger linkage to engagement than others; question 9 (excellent career opportunities) has an impact almost four times that of item 53 (people care about each other) • Items in bold are also key factors associated with turnover *Percentages show relative strength of linkage to engagement; higher percentages mean a stronger linkage
Engagement Index and Customer Index — Percent Favorable by Location Engagement Index Customer Service Index
As the preceding chart suggests, CSAA locations high on the engagement index are also high on the customer service index The correlation between the engagement index and the customer service index is high (.69) Customer Index Engagement Index
Insurance companies that score high on engagement also score high on customer satisfaction Customer Index Engagement Index Source: Towers Perrin’s 2005 Global Workforce Study
We found a strong relationship between engagement, customer satisfaction, and expense ratio; in turn, expense ratio drives combined ratio Engagement -.54* Expense Ratio Combined Ratio .67* Customer Satisfaction -.72* Loss Ratio Numbers shown for tested relationships (solid arrows) are correlation coefficients; these range from 0 to 1, with 1 indicating two variables are perfectly related to each other. * indicates a statistically significant relationship. Dashed arrows show relationships that exist by definition.
Actions Taken -- Division action planning • Train supervisors to lead career pathing discussions • Launch “coffee and conversation” programs with execs • Increase frequency of department social events • Invite cross-enterprise guest speakers to Town Halls • Enhance on-boarding activities • Make mid-year discussions more robust • Enhance rewards and recognition programs
Actions Taken -- Division action planning (cont’d) • Increase frequency of Brown Bags • Create executive “day on the frontline” program • Increase frequency of executive face-to-face sessions • Build cross-training programs • Create department working agreements • Create an online suggestion forum • Hold focus groups to assess progress
Actions Taken -- Enterprise • Posted action plans on intranet • Held full-day “Empowering the Employee” sessions for all employees • Increased focus on talent management – added to executive metrics • Implemented “Goodwill Gesture” empowering front-line employees • Enhanced diversity training for executives • Launched annual day-long leadership conference for managers • Revised staffing policies • Increased visibility of executives • Implemented intranet feedback function for all stories • Launched “Way We Work” initiative to support work flexibility
Looking Ahead • Continue focus on talent management • Build career management tools • Change engagement survey format and cycle time – move to 18-month cycle with mid-cycle “pulse” surveys • Support engagement through AAA University
Lessons Learned • Building engagement takes time, energy and money • Senior leadership must be vocal and visible • Get the demographics right • Overall score can be high -- and there can still be significant work to do in some areas • Divisional acting planning must include senior leadership • Transparency is key – share the good, the bad and the ugly!
Contact Information Marie AndelSenior Vice PresidentCSAAmarie_andel@csaa.com415-565-7876 Tom DavenportPrincipalTowers Perrintom.davenport@towersperrin.com415-836-1127