Download
1 / 30
300 likes | 303 Vues
Nonprofit Comparative Study 2002-2012 Portugal, by Johns Hopkins University, Instituto Nacional de Estatística and Fundação Aga Khan.

E N D
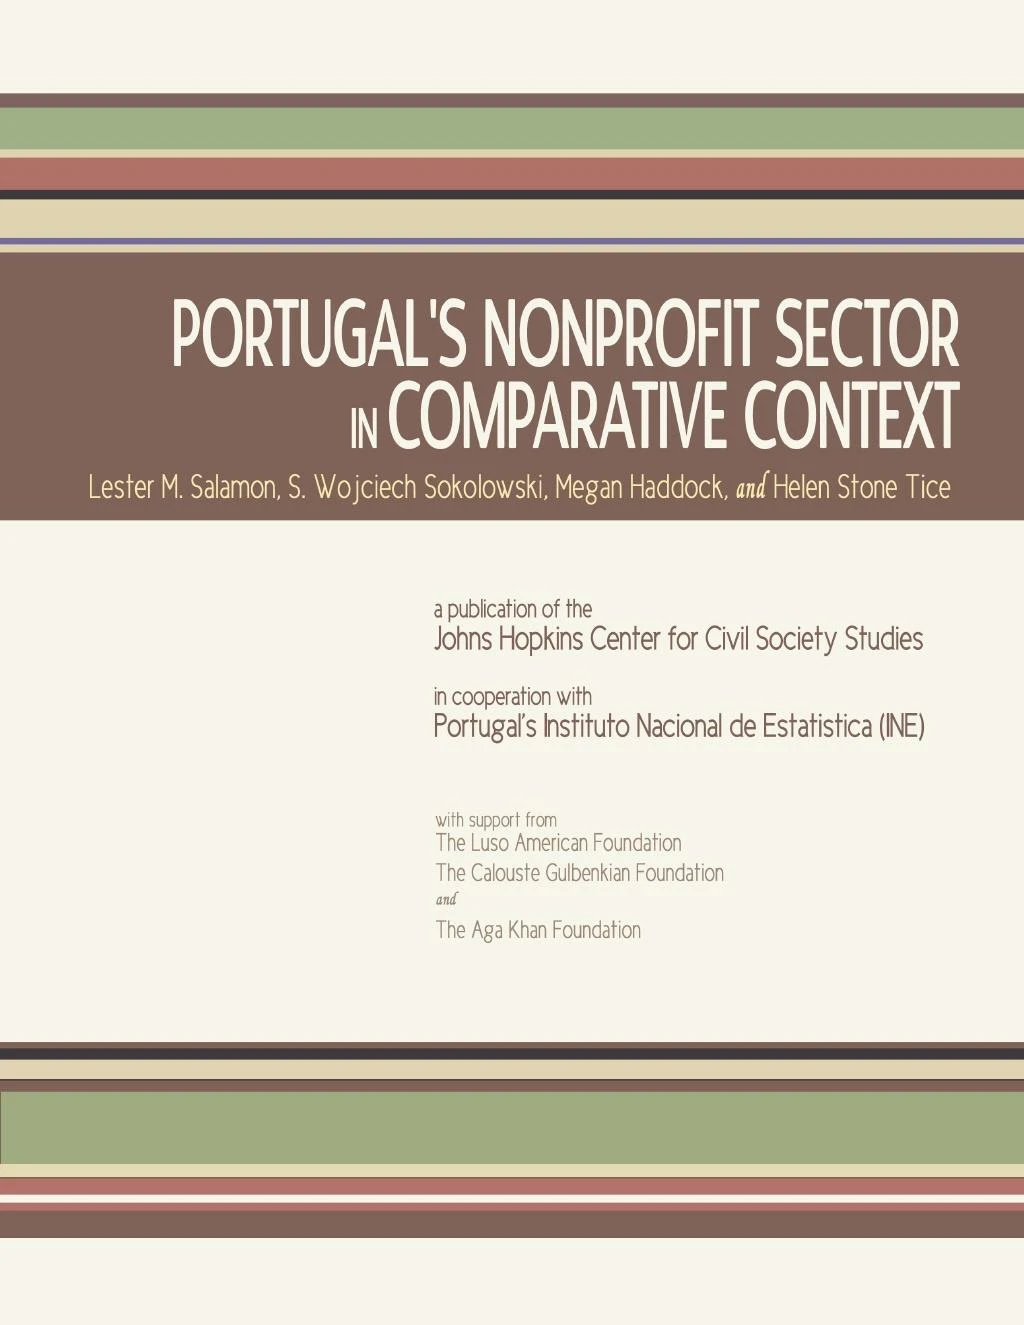
Portugal comparative report-final_4.2012_johns hopkins PORTUGAL’SNONPROFITSECTORINCOMPARATIVECONTEXT Lester M. Salamon S. Wojciech Sokolowski Megan Haddock and Helen Stone Tice a publication of the Johns Hopkins Center for Civil Society Studies in cooperation with Portugal’s Instituto Nacional de Estatistica (INE) with support from The Luso American Foundation The Calouste Gulbenkian Foundation and The Aga Khan Foundation APRIL 2012
PREFACE This is a report comparing the scope, composition, and revenue of the nonprofit sector in Portugal to its counterparts in other countries. The report draws on the important new source of data on nonprofit insti- tutions (NPIs) that has resulted from the implementation of the United Nations Handbook on Nonprofit Institutions in the System of National Accounts, including particularly the recently issued results generated by Portugal’s Instituto Nacional de Estatistica - INE (National Institute for Statistics) in its Nonprofit Institutions Satellite Account.JHU/CCSS Johns Hopkins University This report was produced by researchers at the Johns Hopkins Univer- Center for Civil Society Studies sity Center for Civil Society Studies (JHU/CCSS), who were previously CNP Comparative Nonprofit involved in drafting the UN NPI Handbook, and who have worked with Sector Project national statistical offices, including that in Portugal, to implement this Handbook.1 The findings presented in this report have been reviewed EU European Union by INE officials and by researchers from the Universidade Católica FTE Full Time Equivalent Portuguesa (UCP), which produced a major national study on the non- profit sector in Portugal in 2006 as part of the Johns Hopkins Com- GDP Gross Domestic Product parative Nonprofit Sector Project.2 GVA Gross Value Added The authors are grateful to the President of INE, Alda de Caetano Carvalho, and Carlos Coimbra and Ana Cristina Ramos from the Na- INE Instituto Nacional tional Accounts Department for their cooperation in the production of de Estatistica the NPI satellite account in Portugal and for their assistance in the JHU Johns Hopkins University production and review of this report. This work would not have been possible without Leandro Pontes, Susana Antunes and Alexandra Car- SNA System of National Accounts valho. The authors are also grateful to the Luso-American, Aga Khan, NPI Nonprofit Institution and Calouste Gulbenkian Foundations for their support of this work, and to Raquel Campos Franco from Universidade Católica for her NPISA Nonprofit Institution careful review of the findings. None of these organizations is respon- Satellite Account sible for any interpretations or estimates offered here, however. That responsibility lies with the authors alone. OECD Organization for Economic Cooperation and Development In generating the first-ever “satellite account” on the nonprofit sector in Portugal, the staff of INE has done an enormous service to the Por- UCP Universidade Católica tuguese civil society, or nonprofit, sector. The resulting data should be Portuguesa of enormous help to nonprofit and philanthropic leaders as well as to UN United Nations government officials in demonstrating the considerable scale of this component of the Portuguese economy and in ensuring that this re- UNSD United Nations source for public problem-solving is effectively utilized. Having dem- Statistics Division onstrated its ability to capture this sector in regular national economic data, it is to be hoped that INE will now be able to update this initial satellite account on NPIs on a regular basis going forward. Lester M. Salamon Director Johns Hopkins Center for Civil Society Studies Portugal’s Nonprofit Sector in Comparative Context • Page i PREFACE This is a report comparing the scope, composition, and revenue of the nonprofit sector in Portugal to its counterparts in other countries. The report draws on the important new source of data on nonprofit insti- tutions (NPIs) that has resulted from the implementation of the United Nations Handbook on Nonprofit Institutions in the System of National Accounts, including particularly the recently issued results generated by Portugal’s Instituto Nacional de Estatistica - INE (National Institute for Statistics) in its Nonprofit Institutions Satellite Account.JHU/CCSS Johns Hopkins University This report was produced by researchers at the Johns Hopkins Univer- Center for Civil Society Studies sity Center for Civil Society Studies (JHU/CCSS), who were previously CNP Comparative Nonprofit involved in drafting the UN NPI Handbook, and who have worked with Sector Project national statistical offices, including that in Portugal, to implement this Handbook.1 The findings presented in this report have been reviewed EU European Union by INE officials and by researchers from the Universidade Católica FTE Full Time Equivalent Portuguesa (UCP), which produced a major national study on the non- profit sector in Portugal in 2006 as part of the Johns Hopkins Com- GDP Gross Domestic Product parative Nonprofit Sector Project.2 GVA Gross Value Added The authors are grateful to the President of INE, Alda de Caetano Carvalho, and Carlos Coimbra and Ana Cristina Ramos from the Na- INE Instituto Nacional tional Accounts Department for their cooperation in the production of de Estatistica the NPI satellite account in Portugal and for their assistance in the JHU Johns Hopkins University production and review of this report. This work would not have been possible without Leandro Pontes, Susana Antunes and Alexandra Car- SNA System of National Accounts valho. The authors are also grateful to the Luso-American, Aga Khan, NPI Nonprofit Institution and Calouste Gulbenkian Foundations for their support of this work, and to Raquel Campos Franco from Universidade Católica for her NPISA Nonprofit Institution careful review of the findings. None of these organizations is respon- Satellite Account sible for any interpretations or estimates offered here, however. That responsibility lies with the authors alone. OECD Organization for Economic Cooperation and Development In generating the first-ever “satellite account” on the nonprofit sector in Portugal, the staff of INE has done an enormous service to the Por- UCP Universidade Católica tuguese civil society, or nonprofit, sector. The resulting data should be Portuguesa of enormous help to nonprofit and philanthropic leaders as well as to UN United Nations government officials in demonstrating the considerable scale of this component of the Portuguese economy and in ensuring that this re- UNSD United Nations source for public problem-solving is effectively utilized. Having dem- Statistics Division onstrated its ability to capture this sector in regular national economic data, it is to be hoped that INE will now be able to update this initial satellite account on NPIs on a regular basis going forward. Lester M. Salamon Director Johns Hopkins Center for Civil Society Studies Portugal’s Nonprofit Sector in Comparative Context • Page i
CONTENTSPreface & List of Acronyms i LIST OF BOXES, FIGURES, AND TABLES Boxes I. INTRODUCTION 1. United Nations NPI Handbook 3 Background 1 definition of an NPI Coverage of this report 3 Figures 1. Share of total employment, NPI vs. 4 II. FINDINGS selected industries, Portugal, 2006 1. A significant economic presence: The size of the Portuguese 4 2. Contribution to gross value added, NPI vs. 5 NPI sector selected industries, Portugal, 2006 (SNA 2. Portugal in comparison to other countries 7 based) 8 3. Average employees compensation, NPIs 6 3. Composition of the Portuguese nonprofit sector vs. other sectors, Portugal, 2006 3.1 Distribution of nonprofit activity 8 4. Employee compensation share of gross 6 3.2 Nonprofit share of selected fields 10 value added, by sector, Portugal, 2006 3.3 Composition of Portuguese NPI sector compared to 11 5. NPI share of total employment, by 7 other countries country, ca. 2002-2010 4. Nonprofit finances 12 6. NPI contribution to GDP, by country, ca. 7 4.1 NPI expenditures in Portugal 12 2002-2010 (SNA-based) 4.2 Portugal NPI expenditures compared to other countries 13 7. Distribution of NPI employment, by field, 8 4.3 NPI revenue sources in Portugal 13 Portugal, 2006 4.4 NPI revenue sources in Portugal compared to other 15 8. Distribution of NPI gross value added, by 9 countries field, Portugal, 2006 16 III. CONCLUSION 9. NPI share of employment in selected 10 fields, Portugal, 2006 10. NPI share of gross value added in selected 10 APPENDICES fields, Portugal, 2006 Appendix 1: Data tables from the Satellite Account on Non-Profit 17 11. Distribution of NPI employment by service 11 Institutions in Portugal vs. expressive activities, by country, ca. 2002-2010 Appendix 2: Defining the nonprofit sector in Portugal 19 A.2.1 Current SNA treatment of the NPI sector 19 12. NPI expenditure structure, Portugal, 2006 12 A.2.2 UN NPI Handbook definition of an NPI 19 13. NPI expenditure structure, by country, ca. 13 A.2.3 NPIs in-Scope and out-of-scope in Portugal 20 2002-2010 14. NPI revenue, by type and source, Portugal, 14 Appendix 3: Sources, files and variables used in constructing the 21 2006 NPI Satellite Account 15. NPI revenue, by source, by country, ca. 15 A.3.1 Data sources 21 2002-2010 A.3.2 Data elements 21 Appendix.1 17 NOTES 23 Allocation of nonprofit institutions among institutional sectors of the 1993 SNA and grouped together in an NPI Satellite Account P a g e ii • Portugal’s Nonprofit Sector in Comparative Context CONTENTSPreface & List of Acronyms i LIST OF BOXES, FIGURES, AND TABLES Boxes I. INTRODUCTION 1. United Nations NPI Handbook 3 Background 1 definition of an NPI Coverage of this report 3 Figures 1. Share of total employment, NPI vs. 4 II. FINDINGS selected industries, Portugal, 2006 1. A significant economic presence: The size of the Portuguese 4 2. Contribution to gross value added, NPI vs. 5 NPI sector selected industries, Portugal, 2006 (SNA 2. Portugal in comparison to other countries 7 based) 8 3. Average employees compensation, NPIs 6 3. Composition of the Portuguese nonprofit sector vs. other sectors, Portugal, 2006 3.1 Distribution of nonprofit activity 8 4. Employee compensation share of gross 6 3.2 Nonprofit share of selected fields 10 value added, by sector, Portugal, 2006 3.3 Composition of Portuguese NPI sector compared to 11 5. NPI share of total employment, by 7 other countries country, ca. 2002-2010 4. Nonprofit finances 12 6. NPI contribution to GDP, by country, ca. 7 4.1 NPI expenditures in Portugal 12 2002-2010 (SNA-based) 4.2 Portugal NPI expenditures compared to other countries 13 7. Distribution of NPI employment, by field, 8 4.3 NPI revenue sources in Portugal 13 Portugal, 2006 4.4 NPI revenue sources in Portugal compared to other 15 8. Distribution of NPI gross value added, by 9 countries field, Portugal, 2006 16 III. CONCLUSION 9. NPI share of employment in selected 10 fields, Portugal, 2006 10. NPI share of gross value added in selected 10 APPENDICES fields, Portugal, 2006 Appendix 1: Data tables from the Satellite Account on Non-Profit 17 11. Distribution of NPI employment by service 11 Institutions in Portugal vs. expressive activities, by country, ca. 2002-2010 Appendix 2: Defining the nonprofit sector in Portugal 19 A.2.1 Current SNA treatment of the NPI sector 19 12. NPI expenditure structure, Portugal, 2006 12 A.2.2 UN NPI Handbook definition of an NPI 19 13. NPI expenditure structure, by country, ca. 13 A.2.3 NPIs in-Scope and out-of-scope in Portugal 20 2002-2010 14. NPI revenue, by type and source, Portugal, 14 Appendix 3: Sources, files and variables used in constructing the 21 2006 NPI Satellite Account 15. NPI revenue, by source, by country, ca. 15 A.3.1 Data sources 21 2002-2010 A.3.2 Data elements 21 Appendix.1 17 NOTES 23 Allocation of nonprofit institutions among institutional sectors of the 1993 SNA and grouped together in an NPI Satellite Account P a g e ii • Portugal’s Nonprofit Sector in Comparative Context
This report compares the scope, composition and revenue of the PortugueseINTRODUCTION nonprofit sector to its counterparts in 15 other countries using data from the first- ever Nonprofit Institution Satellite Account produced by Portugal’s Instituto Nacional de Estatistica - INE (National Institute for Statistics) in compliance with the United Nations Handbook on Nonprofit Institutions in the System of National 3 Accounts (UN NPI Handbook). Satellite accounts are developed in order to present a more detailed picture of a particular section of the economy than is available through established statistical reporting procedures. BACKGROUND The idea of treating nonprofit institutions (NPIs) as a distinct sector of the economy has become increasingly prevalent in recent years due in large part to an increased recognition of the important role nonprofit institutions often play in the delivery of public services and in the expression of public sentiments. NPIs are different from private businesses because they do not distribute any profit or surplus they may earn to shareholders, directors, or members, allowing them a certain degree of independence from market forces. At the same time, they are also institutionally separate from government, and therefore are not subjected to the same policy constraints as government agencies. As a result, NPIs are believed to make special contributions to the solution of public problems and the 4 enrichment of national life. Until recently, reliable data on nonprofit institutions were scarce or non-existent in most countries, which posed a serious obstacle for assessing the role these organizations play in national life. An important reason for this was the treatment of nonprofit institutions in the System of National Accounts, the guidance system for the collection and reporting of economic data by national statistical agencies 5 around the world. The first effort to overcome these limitations and develop internationally comparable data on the size and scope of the nonprofit sector in Portugal was completed in 2006 by Raquel Campos Franco, Professor and Researcher at the Universidade Católica Portuguesa (UCP) as part of the Johns Hopkins Comparative 6 Nonprofit Sector Project (CNP). Her work in the early 2000s to portray the basic contours of the nonprofit and volunteer sector, and to document its size and revenue, was a landmark study that established a conceptual framework for 7 defining this set of institutions and their activities in Portugal. Portugal’s Nonprofit Sector in Comparative Context • Page 1 This report compares the scope, composition and revenue of the PortugueseINTRODUCTION nonprofit sector to its counterparts in 15 other countries using data from the first- ever Nonprofit Institution Satellite Account produced by Portugal’s Instituto Nacional de Estatistica - INE (National Institute for Statistics) in compliance with the United Nations Handbook on Nonprofit Institutions in the System of National 3 Accounts (UN NPI Handbook). Satellite accounts are developed in order to present a more detailed picture of a particular section of the economy than is available through established statistical reporting procedures. BACKGROUND The idea of treating nonprofit institutions (NPIs) as a distinct sector of the economy has become increasingly prevalent in recent years due in large part to an increased recognition of the important role nonprofit institutions often play in the delivery of public services and in the expression of public sentiments. NPIs are different from private businesses because they do not distribute any profit or surplus they may earn to shareholders, directors, or members, allowing them a certain degree of independence from market forces. At the same time, they are also institutionally separate from government, and therefore are not subjected to the same policy constraints as government agencies. As a result, NPIs are believed to make special contributions to the solution of public problems and the 4 enrichment of national life. Until recently, reliable data on nonprofit institutions were scarce or non-existent in most countries, which posed a serious obstacle for assessing the role these organizations play in national life. An important reason for this was the treatment of nonprofit institutions in the System of National Accounts, the guidance system for the collection and reporting of economic data by national statistical agencies 5 around the world. The first effort to overcome these limitations and develop internationally comparable data on the size and scope of the nonprofit sector in Portugal was completed in 2006 by Raquel Campos Franco, Professor and Researcher at the Universidade Católica Portuguesa (UCP) as part of the Johns Hopkins Comparative 6 Nonprofit Sector Project (CNP). Her work in the early 2000s to portray the basic contours of the nonprofit and volunteer sector, and to document its size and revenue, was a landmark study that established a conceptual framework for 7 defining this set of institutions and their activities in Portugal. Portugal’s Nonprofit Sector in Comparative Context • Page 1
Another attempt to quantify the dimensions of the nonprofit sector was recently 8carried out by Ana Carvalho of the University of Minho. This project followed asomewhat different methodology than that developed by the CNP and drew onemployment data collected by the Ministry of Labor and Social Solidarity.These initial private research efforts demonstrated that the nonprofit sector inPortugal represents a significant force, but also highlighted the need for theproduction of regularly updated, official, data on the sector.To this end, INE responded to the issuance in 2003 by the United Nations StatisticalDivision (UNSD) of a new United Nations Handbook on Nonprofit Institutions in theSystem of National Accounts (UN NPI Handbook) by committing itself to developingthe “satellite account” on the nonprofit sector that this Handbook calls for.Developed in partnership with the Johns Hopkins University Center for Civil SocietyStudies (CCSS), and drawing largely on the methodology pioneered by the CNP, theUN NPI Handbook offers governments a useful methodology for preparing suchsatellite accounts on nonprofit institutions as part of their regular national accountseconomic data-collection and reporting.The 1993 System of National Accounts (SNA) is a coherent, integrated set ofmacroeconomic accounts, balance sheets, and tables that government statisticalagencies use to form the basis for developing estimates of their national economies(e.g., estimates of GDP). It is based on a set of internationally agreed concepts,definitions, classifications, and accounting rules. These accounts provide acomprehensive and detailed record of the complex economic activities taking place 9within an economy and of the interaction among the different economic actors.Although the 1993 SNA is an invaluable tool for measuring the economic activitiesof economies, its ability to provide a clear picture of the nonprofit sector has longbeen restricted by a methodological approach that buries significant portions of thissector in the business sector, and thus only permits a portion (often quite small) ofthe nonprofit sector to be visible in the statistical data. In particular, nonprofitorganizations that either serve businesses (e.g. chambers of commerce) or receivesubstantial parts of their revenue from what are considered “market sales,” even ifthese sales are partially subsidized by government social benefit payments, areallocated to the business sector in the national accounts and lose their identity asnonprofit institutions. As a result, only a very small portion of the entire nonprofit 10sector has been identifiable in national accounts statistics.The UN NPI Handbook addressed this limitation by developing a methodology foridentifying all NPIs, regardless of the source of their income and the sector to whichthey have consequently been assigned.Page 2 • Portugal’s Nonprofit Sector in Comparative Context Another attempt to quantify the dimensions of the nonprofit sector was recently 8carried out by Ana Carvalho of the University of Minho. This project followed asomewhat different methodology than that developed by the CNP and drew onemployment data collected by the Ministry of Labor and Social Solidarity.These initial private research efforts demonstrated that the nonprofit sector inPortugal represents a significant force, but also highlighted the need for theproduction of regularly updated, official, data on the sector.To this end, INE responded to the issuance in 2003 by the United Nations StatisticalDivision (UNSD) of a new United Nations Handbook on Nonprofit Institutions in theSystem of National Accounts (UN NPI Handbook) by committing itself to developingthe “satellite account” on the nonprofit sector that this Handbook calls for.Developed in partnership with the Johns Hopkins University Center for Civil SocietyStudies (CCSS), and drawing largely on the methodology pioneered by the CNP, theUN NPI Handbook offers governments a useful methodology for preparing suchsatellite accounts on nonprofit institutions as part of their regular national accountseconomic data-collection and reporting.The 1993 System of National Accounts (SNA) is a coherent, integrated set ofmacroeconomic accounts, balance sheets, and tables that government statisticalagencies use to form the basis for developing estimates of their national economies(e.g., estimates of GDP). It is based on a set of internationally agreed concepts,definitions, classifications, and accounting rules. These accounts provide acomprehensive and detailed record of the complex economic activities taking place 9within an economy and of the interaction among the different economic actors.Although the 1993 SNA is an invaluable tool for measuring the economic activitiesof economies, its ability to provide a clear picture of the nonprofit sector has longbeen restricted by a methodological approach that buries significant portions of thissector in the business sector, and thus only permits a portion (often quite small) ofthe nonprofit sector to be visible in the statistical data. In particular, nonprofitorganizations that either serve businesses (e.g. chambers of commerce) or receivesubstantial parts of their revenue from what are considered “market sales,” even ifthese sales are partially subsidized by government social benefit payments, areallocated to the business sector in the national accounts and lose their identity asnonprofit institutions. As a result, only a very small portion of the entire nonprofit 10sector has been identifiable in national accounts statistics.The UN NPI Handbook addressed this limitation by developing a methodology foridentifying all NPIs, regardless of the source of their income and the sector to whichthey have consequently been assigned.Page 2 • Portugal’s Nonprofit Sector in Comparative Context
COVERAGE OF THIS REPORTBOX 1 This report follows the guidance provided in the UN NPI Handbook by defining the nonprofit sector as the set of organizations that do not distribute any profits theyNPI Handbook may earn to their owners or directors, that are institutionally separate from gov-definition of an NPI ernment, that are self-governing, and in which participation is non-compulsory. 11 In the context of Portugal, the following types of legal entities were considered to fitThe UN NPI Handbook the UN NPI Handbook as valid nonprofit institutions so long as they met the UN criteria:defines NPIs as units thatare: a) Associations b) Foundations (including public foundations)→ Organizations c) Public entities ruled by administrative law d) International collective bodies→ Non-profit distributing e) Religious entities→ Institutionally separate This meant that the following types of entities are covered by this report: from government a) All associations and foundations→ Self-governing b) Private hospitals and social service agencies c) Mutualist associations formed under the statute of Private Institutions→ Non-compulsory for Social Solidarity d) Housing and social solidarity cooperatives e) Government units classified as nonprofit institutions f) Business associations, chambers of commerce and similar market pro- ducers g) Misericordias (Holy Houses of Mercy) h) Religious orders (“brotherhoods”) i) Private universities, if they have a legal nonprofit status as identified above j) Public-private research institutions serving households12 Not included are market producers, including cooperatives that distribute profits to 13 their members; units controlled by public entities (such as government-owned hospitals, public health insurance plans, public universities); and entities that take the legal form of association but are out-of-scope of the NPI Handbook definition. Portugal’s Nonprofit Sector in Comparative Context • Page 3 COVERAGE OF THIS REPORTBOX 1 This report follows the guidance provided in the UN NPI Handbook by defining the nonprofit sector as the set of organizations that do not distribute any profits theyNPI Handbook may earn to their owners or directors, that are institutionally separate from gov-definition of an NPI ernment, that are self-governing, and in which participation is non-compulsory. 11 In the context of Portugal, the following types of legal entities were considered to fitThe UN NPI Handbook the UN NPI Handbook as valid nonprofit institutions so long as they met the UN criteria:defines NPIs as units thatare: a) Associations b) Foundations (including public foundations)→ Organizations c) Public entities ruled by administrative law d) International collective bodies→ Non-profit distributing e) Religious entities→ Institutionally separate This meant that the following types of entities are covered by this report: from government a) All associations and foundations→ Self-governing b) Private hospitals and social service agencies c) Mutualist associations formed under the statute of Private Institutions→ Non-compulsory for Social Solidarity d) Housing and social solidarity cooperatives e) Government units classified as nonprofit institutions f) Business associations, chambers of commerce and similar market pro- ducers g) Misericordias (Holy Houses of Mercy) h) Religious orders (“brotherhoods”) i) Private universities, if they have a legal nonprofit status as identified above j) Public-private research institutions serving households12 Not included are market producers, including cooperatives that distribute profits to 13 their members; units controlled by public entities (such as government-owned hospitals, public health insurance plans, public universities); and entities that take the legal form of association but are out-of-scope of the NPI Handbook definition. Portugal’s Nonprofit Sector in Comparative Context • Page 3
1 • A significant economic presence: FINDINGS The size of the Portuguese NPI sectorIn 2006, nonprofit institutions (NPIs) in Portugal employed nearly 185,000 workers. 14These workers produced goods and services worth over €5.7 billion, and ultimate- 15ly contributed €2.7 billion of Gross Value Added to the national economy.To make these numbers understandable, it may be useful to compare the size of thenonprofit sector in Portugal to Portugal’s other major industries, as well as to NPI sec-tors in other countries on which comparable data are available. These comparisonsreveal that the size of the NPI sector in Portugal is relatively substantial when meas-ured in terms of employment but considerably smaller when measured in terms ofcontribution to the country’s gross domestic product. As noted below, this may bebecause wages in Portugal’s nonprofit sector are low compared to those in other eco-nomic sectors.Perhaps the most accurate measurement of the scaleof nonprofit activity is the size of its workforce. Notonly do nonprofits tend to concentrate in labor-intensive service industries, but they also provide asubstantial amount of services at no or reduced cost FIGURE 1to the recipients. Therefore, the effort expended to Share of total employment, NPIs vs. selected industries*,produce these services is the most direct indicator of Portugal, 2006the scope of nonprofit activity. Manufacturing 19.2%As shown in FIGURE 1, the NPI sector’s workforce of185,000 workers represents 4.3 percent of Portug- Trade 17.4% 16al’s total employment. This turns out to be the Construction 11.6%eighth largest workforce in the country when com- Public administration 7.8%pared to all Portuguese industries—larger than the Health & social assistance 7.2%agriculture (2.3 percent), financial services (2.0 per- Education 7.0%cent), and publishing and broadcasting (1.5 percent)industries. Accommodation & food service 6.1% NONPROFIT SECTOR NONPROFIT SECTOR 4.3%An alternative approach to measuring the scale of Agriculture 2.3%nonprofit activity is to look at how much value it adds Financial & insurance 2.0%to the national economy. This is, in fact, a standard Publishing, broadcasting, telecom 1.5%measure of the size of economic activity used by Wate and waste management 0.9%economists. The Gross Value Added (GVA) by non-profits in Portugal—€2.7 billion—adds 2.0 percent Real estate 0.6%to the national economy. Arts, entertainment, recreation 0.6% Mining 0.4% * NPIs are excluded from industry employment to avoid double counting. Source: INEPage 4 • Portugal’s Nonprofit Sector in Comparative Context 1 • A significant economic presence: FINDINGS The size of the Portuguese NPI sectorIn 2006, nonprofit institutions (NPIs) in Portugal employed nearly 185,000 workers. 14These workers produced goods and services worth over €5.7 billion, and ultimate- 15ly contributed €2.7 billion of Gross Value Added to the national economy.To make these numbers understandable, it may be useful to compare the size of thenonprofit sector in Portugal to Portugal’s other major industries, as well as to NPI sec-tors in other countries on which comparable data are available. These comparisonsreveal that the size of the NPI sector in Portugal is relatively substantial when meas-ured in terms of employment but considerably smaller when measured in terms ofcontribution to the country’s gross domestic product. As noted below, this may bebecause wages in Portugal’s nonprofit sector are low compared to those in other eco-nomic sectors.Perhaps the most accurate measurement of the scaleof nonprofit activity is the size of its workforce. Notonly do nonprofits tend to concentrate in labor-intensive service industries, but they also provide asubstantial amount of services at no or reduced cost FIGURE 1to the recipients. Therefore, the effort expended to Share of total employment, NPIs vs. selected industries*,produce these services is the most direct indicator of Portugal, 2006the scope of nonprofit activity. Manufacturing 19.2%As shown in FIGURE 1, the NPI sector’s workforce of185,000 workers represents 4.3 percent of Portug- Trade 17.4% 16al’s total employment. This turns out to be the Construction 11.6%eighth largest workforce in the country when com- Public administration 7.8%pared to all Portuguese industries—larger than the Health & social assistance 7.2%agriculture (2.3 percent), financial services (2.0 per- Education 7.0%cent), and publishing and broadcasting (1.5 percent)industries. Accommodation & food service 6.1% NONPROFIT SECTOR NONPROFIT SECTOR 4.3%An alternative approach to measuring the scale of Agriculture 2.3%nonprofit activity is to look at how much value it adds Financial & insurance 2.0%to the national economy. This is, in fact, a standard Publishing, broadcasting, telecom 1.5%measure of the size of economic activity used by Wate and waste management 0.9%economists. The Gross Value Added (GVA) by non-profits in Portugal—€2.7 billion—adds 2.0 percent Real estate 0.6%to the national economy. Arts, entertainment, recreation 0.6% Mining 0.4% * NPIs are excluded from industry employment to avoid double counting. Source: INEPage 4 • Portugal’s Nonprofit Sector in Comparative Context
As shown in FIGURE 2, this represents about three times as much as the value added by mining and qua- FIGURE 2 rrying (0.6 percent), and arts, entertainment and Contribution to gross value added, NPI vs. selected indistries*, recreation services (0.8 percent), and twice as much as Portugal, 2006 (SNA based) water and waste management (1.0 percent). However, the NPI sector ranked below most other industries and agriculture in terms of value added. Manufacturing 14.3% How do we explain this discrepancy between the NPI Trade 13.7% share of total employment and the share of the value added to the economy? Two explanations seem possi- Public administration 8.8% ble: a) differences in employee compensation, and b) 17 Real estate differences in the labor share of value added. 7.8% Construction 7.3% a) Differences in employee compensation. The value added to the economy by an institutional unit de- Financial & insurance 7.2% pends, to a large extent, on the value of the labor time it engages. The higher the employee compensation, Education 6.9% the higher the value of goods and services added to the national economy. Likewise, if the compensation of Health & social assistance 5.8% employees in a particular sector of the economy is lower than that of other sectors, the value added will Accommodation & food service 4.9% also be lower than that of sectors paying better wages, even though the number of people it employs may bePublishing, broadcasting, telecom 3.8% relatively high. Agriculture 2.7% This indeed seems to be the case for NPIs in Portugal. As FIGURE 3 shows, the average employee compensa- NONPROFIT SECTOR NONPROFIT SECTOR 2.0% tion in the nonprofit sector (€14,709) is below the na- tional average (€18,679) and well below the average Waste & waste management 1.0% compensation paid by financial corporations and gov- ernment. Arts, entertainment, recreation 0.8% Of course, these differences in employee Mining 0.6% compensation do not indicate that nonprofit workers are “less valuable” or “less important,” but rather that they tend to serve people who cannot afford to pay higher prices for the services they receive. From that * NPIs are excluded from industry employment to avoid double counting. point of view, the difference in compensation can be Source: INE interpreted as a form of charitable contribution made by nonprofit workers to the recipients of their services. Portugal’s Nonprofit Sector in Comparative Context • Page 5 As shown in FIGURE 2, this represents about three times as much as the value added by mining and qua- FIGURE 2 rrying (0.6 percent), and arts, entertainment and Contribution to gross value added, NPI vs. selected indistries*, recreation services (0.8 percent), and twice as much as Portugal, 2006 (SNA based) water and waste management (1.0 percent). However, the NPI sector ranked below most other industries and agriculture in terms of value added. Manufacturing 14.3% How do we explain this discrepancy between the NPI Trade 13.7% share of total employment and the share of the value added to the economy? Two explanations seem possi- Public administration 8.8% ble: a) differences in employee compensation, and b) 17 Real estate differences in the labor share of value added. 7.8% Construction 7.3% a) Differences in employee compensation. The value added to the economy by an institutional unit de- Financial & insurance 7.2% pends, to a large extent, on the value of the labor time it engages. The higher the employee compensation, Education 6.9% the higher the value of goods and services added to the national economy. Likewise, if the compensation of Health & social assistance 5.8% employees in a particular sector of the economy is lower than that of other sectors, the value added will Accommodation & food service 4.9% also be lower than that of sectors paying better wages, even though the number of people it employs may bePublishing, broadcasting, telecom 3.8% relatively high. Agriculture 2.7% This indeed seems to be the case for NPIs in Portugal. As FIGURE 3 shows, the average employee compensa- NONPROFIT SECTOR NONPROFIT SECTOR 2.0% tion in the nonprofit sector (€14,709) is below the na- tional average (€18,679) and well below the average Waste & waste management 1.0% compensation paid by financial corporations and gov- ernment. Arts, entertainment, recreation 0.8% Of course, these differences in employee Mining 0.6% compensation do not indicate that nonprofit workers are “less valuable” or “less important,” but rather that they tend to serve people who cannot afford to pay higher prices for the services they receive. From that * NPIs are excluded from industry employment to avoid double counting. point of view, the difference in compensation can be Source: INE interpreted as a form of charitable contribution made by nonprofit workers to the recipients of their services. Portugal’s Nonprofit Sector in Comparative Context • Page 5
b) Differences in labor share of value added.While employee compensation represents a major FIGURE 3component of the value added, profits and savings may also Average employee compensation,represent another significant component. Therefore, quite NPIs vs other sectors, Portugal, 2006apart from employee compensation, a sector that distributesmore profits or accrues more savings will have a higher value €50,582added than a sector that does not distribute profits or haslower savings. Since nonprofits do not distribute profits bydefinition, their value added is likely to be lower than that ofcomparable establishments that do. €31,136FIGURE 4 compares the share of value added attributable tothe compensation of employees in different institutional sec-tors. In the nonprofit sector, compensation of employees €18,679 18 €15,656 €14,709represents 86 percent of the GVA which is significantlyhigher than the comparable value in the economy as a whole(57 percent). In this respect, NPIs fall much closer to the gov-ernment sector (87 percent) than the financial sector (40percent) or non-financial corporation sector (51 percent). Financial Government Total Non-financial NPIs NPIs corporations economy corporationsThis means that in the nonprofit sector, non-labor factors(especially profits) contribute very little (14 percent) to the Source: INEsector’s value added, but in the corporate sector these non-labor factors contribute nearly half or more to the value add-ed. As explained earlier, this is the result of the fact that non-profits typically operate in fields where revenues are con- FIGURE 4strained by the service recipients’ inability to pay, and thus Employee compensation share of gross value added,*cannot generate significant surplus (profits or savings). by sector, Portugal, 2006In sum, the relatively low value added of the NPI sector 87% 86%seems to be a result of two factors: the lower than averagewages in the NPI sector, and the low share of non-labor fac-tors (profit and savings) in the sector’s GVA. Considering onlythe value added by the NPI sector, therefore, understates thefull economic impact of the NPI sector, especially in compari- 57% 51%son to the for-profit sector. To obtain a more comprehensiveview of NPI activities, it is also necessary to examine the sec- 40%tor’s employment structure. The paid employment data pre-sented in the 2006 NPI satellite account indicates a muchlarger role of NPIs in the Portuguese economy than the valueadded data alone seems to suggest. Government NPIs NPIs Total Non-financial Financial economy corporations corporations & households * Including subsidies on production Source: INEPage 6 • Portugal’s Nonprofit Sector in Comparative Context b) Differences in labor share of value added.While employee compensation represents a major FIGURE 3component of the value added, profits and savings may also Average employee compensation,represent another significant component. Therefore, quite NPIs vs other sectors, Portugal, 2006apart from employee compensation, a sector that distributesmore profits or accrues more savings will have a higher value €50,582added than a sector that does not distribute profits or haslower savings. Since nonprofits do not distribute profits bydefinition, their value added is likely to be lower than that ofcomparable establishments that do. €31,136FIGURE 4 compares the share of value added attributable tothe compensation of employees in different institutional sec-tors. In the nonprofit sector, compensation of employees €18,679 18 €15,656 €14,709represents 86 percent of the GVA which is significantlyhigher than the comparable value in the economy as a whole(57 percent). In this respect, NPIs fall much closer to the gov-ernment sector (87 percent) than the financial sector (40percent) or non-financial corporation sector (51 percent). Financial Government Total Non-financial NPIs NPIs corporations economy corporationsThis means that in the nonprofit sector, non-labor factors(especially profits) contribute very little (14 percent) to the Source: INEsector’s value added, but in the corporate sector these non-labor factors contribute nearly half or more to the value add-ed. As explained earlier, this is the result of the fact that non-profits typically operate in fields where revenues are con- FIGURE 4strained by the service recipients’ inability to pay, and thus Employee compensation share of gross value added,*cannot generate significant surplus (profits or savings). by sector, Portugal, 2006In sum, the relatively low value added of the NPI sector 87% 86%seems to be a result of two factors: the lower than averagewages in the NPI sector, and the low share of non-labor fac-tors (profit and savings) in the sector’s GVA. Considering onlythe value added by the NPI sector, therefore, understates thefull economic impact of the NPI sector, especially in compari- 57% 51%son to the for-profit sector. To obtain a more comprehensiveview of NPI activities, it is also necessary to examine the sec- 40%tor’s employment structure. The paid employment data pre-sented in the 2006 NPI satellite account indicates a muchlarger role of NPIs in the Portuguese economy than the valueadded data alone seems to suggest. Government NPIs NPIs Total Non-financial Financial economy corporations corporations & households * Including subsidies on production Source: INEPage 6 • Portugal’s Nonprofit Sector in Comparative Context
. 2 • Portugal in comparison to other countriesFIGURE 5 In addition to Portugal, 15 other countries have produced NPI sa-NPI share of total employment, by country, ca. 2002-2010 tellite accounts to date, which makes it possible to gauge the scale of the NPI sector in Portugal by comparing it to that in other coun- Belgium 11.5% tries. 19 Israel 11.2% Canada 10.0% Using the share of NPI employment as the measure of NPI eco- Australia 8.5% nomic activity (FIGURE 5), Portugal ranks 9th, above Brazil, Nor- United States 8.4% way, Kyrgyzstan, Mexico, the Czech Republic, and Thailand, but Japan 7.7% still below two other EU countries on which comparable data are France 5.8% available—France and Belgium. Average* 5.5% New Zealand 4.4% Using the contribution to the GDP, or value added, as the metric PORTUGAL PORTUGAL 4.3% (FIGURE 6) results in a picture of the size of the Portuguese non- Brazil 3.0% profit sector that is substantially below the international average Norway 20 3.0% (2.0 vs. 3.6 percent). Though by this metric the Portuguese non- Kyrgyzstan 2.7% *Unweighted profit sector is larger than that in two other European countries— Mexico 1.1% 15-country average Norway and the Czech Republic—it is far smaller than that in Bel- Czech Republic 0.9% Source: gium (5.7 percent) and France (3.3 percent). Thailand 0.7% Portugal – INE; All other countries – JHU/CCSS To summarize, although the relative size of the nonprofit sector’s economic activity in Portugal varies depending on whether the share of employment or the value added is used as the measure, the overall size of the sector is relatively small in comparison to FIGURE 6 other industries and other developed countries. This finding is NPI contribution to GDP, by country, quite surprising given Portugal’s long history of charitable activi- ca. 2002-2010 (SNA-based) ties, many linked to the Catholic Church, and the strong social economy and cooperative tradition. Canada 6.9% Several possible explanations for this outcome can be hypothe- Israel 6.9% sized. In the first place, Portugal’s relatively recent experience un- Mozambique 6.6% der authoritarianism may have played a role in stifling the NPI sec- Belgium 5.7% tor. Such regimes are typically hostile to the development of civil United States 5.5% society institutions of the sort being examined here. While phi- Australia 4.3% lanthropic and nonprofit institutions have expanded in Portugal Japan 4.0% since the 1976 democratization of the country, such institutions Average* 3.6% typically require decades of enabling legal and political conditions France 3.3% to develop firm social and financial roots. What is more, most of New Zealand 2.8% health services and social assistance in Portugal are provided by Brazil 2.3% the public sector, which “crowded out” Catholic charities from Kyrgyzstan 2.2% these fields, as will be discussed in the next section. Finally, some Mexico 2.0% portion of civil society activities provided through nonprofit institu-PORTUGAL PORTUGAL 2.0% tions in other settings might be handled through market coopera- *Unweighted Norway 1.6% 16-country average tives in Portugal, and are not included in the NPI satellite account. Thailand 0.8% INE does plan to produce a subsequent satellite account on the Source:Czech Republic Portugal – INE; country’s “social economy” sector, which will cover both market 0.6% All other countries – JHU/CCSS and non-market cooperatives and mutuals, and will provide great- er insight into this question. Portugal’s Nonprofit Sector in Comparative Context • Page 7
. 3 • Composition of the nonprofit sectorNonprofit institutions, of course, do notsimply produce economic value. More im-portantly, they perform certain social func- FIGURE 7tions that range from the delivery of human Distribution of NPI employment, by field, Portugal, 2006services, education and research, culturalamenities, and a wide array of civic activities.These various functions fall into two broadcategories: service functions and expressive SERVICE 72%functions. Service functions involve the deli- EXPRESSIVE 19%very of direct services such as education, OTHER 8% Arts,health, housing, economic development entertainment, recreation Otherpromotion, and the like. Expressive functions 3% Public 4%involve activities that provide avenues for the administrationexpression of cultural, spiritual, professional, 5%or policy values, interests, and beliefs. In-cluded here are cultural institutions, sportsand recreation groups, professional associa- Research & developmenttions, advocacy groups, community organiza- Membership 2%tions, environmental organizations, human organizationsrights groups, social movements, and the 16%like. The distinction between service andexpressive activities is approximate, as many Health 21organizations engage in both. Neverthe- 7%less, it can be helpful in comparing the com-position of the nonprofit sector across differ- Social services, Education 52%ent countries. NOTE: 11% Percentages mayA distinctive feature of the Portuguese non- not add to 100% due to rounding.profit sector in comparison to other coun-tries is the unusually large share of organiza- Source: JHU/CCSStions that provide social assistance, which calculationswill be discussed below. This section will also based on INEshow that while the overall contribution of data.the NPI sector to the Portuguese economy asa whole is relatively small, its contribution isquite substantial in the fields where NPIs areactive, especially social work and arts andrecreation.3.1 • Distribution of nonprofit activity As FIGURE 7 shows, most nonprofit activity in Portugal is concentrated in theservice fields, which represents 72 percent of total NPI employment. Of this, so-cial assistance accounts for more than half (52 percent), education accounts for11 percent, and health care represents 7 percent.Page 8 • Portugal’s Nonprofit Sector in Comparative Context
. Unlike the disparate picture of overall nonprofit sizeFIGURE 8 that emerged when looking at the sector’s employ-Distribution of NPI gross value added, by field, Portugal, 2006 ment size as opposed to its contribution to value added, the sector’s composition looks roughly the same whether viewed through the prism of em- ployment or through the prism of value added. Thus, SERVICE 69% as shown in FIGURE 8 service fields account for 69 EXPRESSIVE 21% percent of the total value added by NPIs, roughly OTHER 9% equivalent to the 72 percent of nonprofit employ- ment they engage. The largest of the service fields is social assistance, which accounts for 47 percent of Arts, Research & entertainment, the NPI value added. The remaining three servicedevelopment recreation fields, education (12%), health (8%), and research 2% 8% Other and development (2%) account for the remaining 22 5% percent of the NPI value added. The largest expres- Public sive field, membership organizations, represents 14 Membership administration percent of the total value added by NPIs. Arts and organizations 5% culture, the second largest of the expressive fields 14% accounts for 8 percent of the total. Health 8% These data demonstrate that the dominant NPI ac- tivity in Portugal is the provision of social assistance. Education It is important to note, however, that a significant 12% NOTE: share of social assistance is represented by the Mise- Percentages ricordias (Holy Houses of Mercy), publicly funded Social assistance may not add Catholic relief organizations that provide both social 47% to 100% due 22 assistance as well as health services. There are to rounding. about 400 Misericordias in Portugal operating 19 Source: hospitals that deliver about 90 percent of nonprofit JHU/CCSS 23 calculations health care services. Because of their dual function based on INE in providing both health care and social assistance, data. choosing which field to assign them to posed a chal- lenge for INE, and had consequences for how the ac- tual distribution of nonprofit activity in Portugal is portrayed. Misericordias were ultimately assigned to the social assistance field, but had they been as- signed to the health field instead (in whole or in part), the distribution of nonprofit activity would look rather different. Portugal’s Nonprofit Sector in Comparative Context • Page 9
. 3.2 • Nonprofit share of selected fieldsAlthough the NPI share of overall economic activity FIGURE 9is relatively small, its share is quite large in those NPI share of employment in selected fields, Portugal, 2006fields where nonprofits typically concentrate. Theseinclude the major fields of social assistance; arts,entertainment ,and recreation; and membership Membership organizations 97%organizations. But as with its overall contribution tothe economy, the nonprofit sector’s contribution in Social assistance 83%the different fields is greater when measured interms of employment than when measured in Sporting activities 41%terms of value added. Theaters 29%Looking first at employment, as shown in FIGURE 9,NPIs employ 97 percent of workers in membership Recreation 21%organizations. Furthermore, social assistance NPIstogether about 83 percent of all workers in this field(doubtless due in important part to the inclusion of Libraries & museums 9%the Misericordias in the social assistance category).In sporting activities, NPIs employ 41 percent of all Health 7%workers. In the remaining five fields, the NPI sharesof total employment range from 21 percent in Education 7%recreation to 7 percent in education. Source: INEA somewhat different picture of the nonprofit rolein particular fields emerges from looking at data onthe value added in the respective fields (FIGURE 10)Thus, while Portuguese nonprofits accounted for 83 FIGURE 10percent of employment in social assistance, they NPI share of gross value added in selected fields, Portugal, 2006account for only 76 percent of the value added inthis field. Similarly, while nonprofits account for 41percent of the employment in sporting activities, Membership organizations 94%they account for a smaller 35 percent of the valueadded. Similar patterns exist in all of the fields as Social assistance 76%well. Sporting activities 35%What these data suggest is that NPI wages are notonly lower than country-wide wages overall, but Recreation 16%they are lower than for-profit or government wageseven in the fields where nonprofits are most active- Theaters 10%ly involved. Libraries & museums 8% Health 4% Education 3% Source: INEP a g e 10 • Portugal’s Nonprofit Sector in Comparative Context
. 3.3 • Composition of Portuguese NPI sector compared to other countries The distribution of nonprofit activity by major type of activity in Portugal is fairly typical compared to that in other countries that have completed satellite accounts, at least when measured in terms of employment. Given the ambiguities in separating certain activity fields (such as health and social assistance, education and research, or civic and occupa- tional activities), it is most fruitful to compare countries in terms of the distribution of non- 24 profit activity between the basic service and expressive fields. These data reveal that Por- tugal’s shares of service and expressive activities (at 72 and 19 percent, respectively) are 25 very close to the 13-country average (at 71 and 24 percent, respectively) as shown in FIGURE 11. In sum, Portugal’s nonprofit sector is composed of a larger than average share of social service activities. This is likely a reflection of the fact that a major set of human service pro- viders in the country, the Misericordias, have been classified solely into the social assistance field in Portugal even though a substantial portion of their activity is in the health field. However, when looking from the perspective of more broadly defined service vs. expres- sive activities, the composition of Portugal’s nonprofit sector is close to the international average.FIGURE 11Distribution of NPI employment by service vs. expressive activities, Portugal vs. 12 countries, ca. 2002-2010 SERVICE Japan 88% 9% EXPRESSIVE Israel 84% 11% 5% OTHER Belgium 83% 15% France 82% 17% United States 80% 15% 5% Czech Republic 76% 23% Canada 74% 22% PORTUGAL PORTUGAL 72% 19% 8% Average* 71% 24% 5% Australia 67% 19% 14% New Zealand 67% 31% Norway 59% 39% Brazil 55% 45%*13-country averageSource: Mexico 40% 60%Portugal – INE;All other countries – JHU/CCSS Portugal’s Nonprofit Sector in Comparative Context • Page 11
. 4 • Nonprofit financesAnalyzing nonprofit revenues and expendituresthrough the lens of national accounts aggregatescan be a challenging task because the accounting FIGURE 12 NPI expenditure structure, Portugal, 2006concepts used in national accounts do not alwayscorrespond to those typically associated with indi-vidual organizations. As a result, the national ac-counts concepts must be “translated” into com-monly understood financial concepts pertaining to CompensationNPIs, but this “translation” is not always fully possi- of employeesble due to data limitations. 46%We focus first on the operating expenditures of NPIsand their distribution by major type, and then con-centrate on the revenues and their distribution by Purchases oftransaction type and source. The resulting picture of goods & servicesexpenditures and revenues that emerges from the 51%translation of national accounting aggregates re-veals that the Portuguese NPI sector tends to spend Other*a smaller share of its resources on employee com- 3%pensation than NPIs in most other countries onwhich data are available. At the same time, theshares of revenues coming from market sales, gov- Total = €5.9 billionernment payments, and private transfers do notdiffer markedly from those in most other countries * Includes rent, interest, and taxes.on which data are available; however, these findings Source: JHU/CCSS calculations based on INE datashould be viewed as preliminary because an un-usually large share of this revenue could not be at-tributed to any of these three sources.4.1 • NPI expenditures in PortugalNPIs incur various types of expenditures in the production of goods and services.The national accounts group these expenditures into four major categories: (a) pur-chases of goods and services from other sectors of the economy, mainly corpora-tions (“intermediate consumption”); (b) wages and benefits paid to people em-ployed by NPIs; (c) interest and rent paid by NPIs; and (d) taxes. In the case of NPIs,the last two categories entail relatively small sums of money, and are thus groupedtogether for the purpose of this report.As shown in FIGURE 12, the operating expenditures of Portuguese NPIs totaled 26nearly €5.9 billion in 2006. Over half (51 percent) of these expenditures weremade in the purchase of goods and services from other institutional units of theeconomy that were used by the NPIs to carry out their missions. Wages and bene-fits for employees accounted for 46 percent of expenditures, and rent, interestpayments and taxes accounted for only 3 percent.P a g e 12 • Portugal’s Nonprofit Sector in Comparative Context
. 4.2 • Portugal NPI expenditures FIGURE 13 GOODS & SERVICES compared to other countries NPI expenditure structure*, COMPENSATION As shown in FIGURE 13, the employee compensa- by country, ca. 2002-2010 tion share of NPI operating expenditures is rela- TAXES tively low in Portugal compared to that in other countries (48 vs. 53 percent average for other Brazil 60% 39% 27 countries). A likely explanation is the low wages Czech Republic 56% 44% paid by Portuguese NPIs (see Figure 3 above). New Zealand 55% 41% PORTUGAL PORTUGAL 52% 48% 4.3 • NPI revenue sources in Portugal To provide a composite picture of the NPI reve- Japan 49% 50% nue structure, the UN NPI Handbook recom- mends grouping NPI revenue both by the type of Kyrgyzstan 48% 52% transaction, i.e., market sales, transfers (which in- clude grants and donations), and property in- Thailand 48% 52% come; as well as by the source of these funds, i.e., government, corporations, and households. Average† 45% 53%*Rent andinterst Mozambique 44% 56% The Portuguese satellite account data compiledpayments by INE contain aggregate information about NPIexcluded due Canada 41% 58% revenue from transfers, market sales, and prop-to data erty income; however these revenue streams areunavailablity. Belgium 41% 59% not broken down by source.†13-countryaverage Mexico 38% 62% Of particular concern is identifying NPI revenueSource: from government sources, including both gov-Portugal –INE; United States 29% 70% ernment purchase of NPI goods and services onAll other the market and government transfers. Govern-countries – Australia 22% 53% 25% ment payments to NPIs for services take the formJHU/CCSS of either government contracts or reimburse- ments for services rendered by NPIs to house- holds. Because the data sources on which the Portuguese satellite account relies do not distin- guish the source of market sales, it is impossible to estimate the share of market sales attributable to government reimbursements. In the case of transfers, government transfers are merged with private transfers from households and other insti- tutions. Here, however, unpublished National Ac- counts working tables compiled by INE are avail- able to determine at least a portion of govern- 28 ment transfers. Portugal’s Nonprofit Sector in Comparative Context • Page 13
. Given the data limitations, our estimate of the government share of NPI revenue in Portugalremains incomplete and focuses only on those resources received by NPIs from government inthe form of transfers—including government grants, but not reimbursements or contract pay-ments. While this procedure is likely to underestimate the actual value of nonprofit revenuesthat originate in government payments, this proved to be the best first-approximation given thedata limitations.FIGURE 14 shows the estimate of the distribution of FIGURE 14 GOVERNMENT 41% Revenue of NPIs, by type and source,NPI revenue in Portugal by type and source that re- FEES 31% Portugal, 2006sults from this procedure. OTHER 19%Our revenue estimation takes as the starting point PHILANTHROPY 10% 29transactions reported in NPISA, which total (€4,767.4 Other*million.) This value is lower than the total value of 19% Sales of goods &operating expenditures reported in Section 4.1 above. services 23%We hypothesize that the difference (€ 1,103.4 million)may represent NPI revenues not explicitly identified in Other currentNPISA and report it as “other revenue.” private transfers Property income 10% 8%Revenue from fees comes to 31 percent of NPI reve- Subsidies Other currentnue. Included here is revenue from the sale of goods Taxes received government 7%and services (23 percent), and property income (divi- 3% transfersdends and rents received) which represents an addi- 30%tional 8 percent of NPI revenue. For the purpose of Total = €5.9 billioncross national comparison, these two revenue sourcesare combined into a single category called “fees.” We * Difference between expenditures and income from fees, government, and philanthropy.treat these fees as coming from the private sector, Percentages may not add to 100% due to rounding.even though some portion is probably attributable to Source: JHU/CCSS estimates based on INE datagovernment, as noted above.We estimate that government funds account for about 41 percent of NPI revenue, though this iscould be an underestimate of the true total for the reasons explained above. This revenue cate- 30gory includes subsidies on production (7 percent), other current transfers from government(30 percent), as well as taxes received by NPIs in the government sector (3 percent).Transfers from the private sector, which include private philanthropy, membership dues, corpo-rate gifts, and similar payments to NPIs account for 10 percent of NPI revenue. Although mem-bership dues are treated as “gifts” in national accounts, a significant share of them are actuallyfees for services (e.g., membership in clubs providing recreational or leisure activities). Further-more, transfers from other EU countries may be included here as well. Therefore, this estimateprobably overstates the value of private philanthropic donations to nonprofits.The “other” category represents the balance between NPI expenditures and the total of NPIrevenues received from fees, government, and philanthropy as described above. Figure 14 thusshows that 19 percent of NPI revenue in Portugal is received from some other source, thoughdue to data limitations it is not clear what kind of money flow or source this represents. Severalpossibilities include donations in kind received by NPIs, bank loans, proceeds from the sale ofassets, transfers from abroad, or a statistical discrepancy resulting from data limitations or me-thodological differences in estimating different types of transactions involving NPIs.P a g e 14 • Portugal’s Nonprofit Sector in Comparative Context
. FIGURE 15NPI revenue, by source, by country, ca. 2002-2010 Kyrgyzstan 85% 11% 5% FEES New Zealand 67% 9% 24% GOVERNMENT Japan 61% 38% PRIVATE TRANSFERS Australia 51% 33% 11% OTHER Brazil 47% 11% 29% 13% Average* 44% 30% 22% Canada 42% 51% 8% Belgium 37% 57% 4% Israel 33% 52% 15% PORTUGAL PORTUGAL 31% 41% 10% 19% Czech Republic 30% 48% 22% Thailand 29% 10% 57% *13-country average Source: Mozambique 13% 84% Portugal – INE; All other countries – JHU/CCSS 4.4 • NPI revenue sources in Portugal compared to other countries Comparing Portugal’s NPI revenue structure to those of other countries on which compa- rable data are available shows that, on the one hand, the share of revenue from govern- ment in Portugal appears to be similar to those in other OECD countries. As FIGURE 15 shows, at 41 percent, the government share of NPI revenue in Portugal is above the 12- country average (30 percent), while below that of other EU countries (Belgium – 57 per- cent, Czech Republic – 48 percent) and Canada (51 percent), and higher than that of Aus- 31 tralia (33 percent) Japan (38 percent) and New Zealand (9 percent). However, the fee share in Portugal appears markedly below the 13-country average (31 vs. 44 percent, respectively) and also appears to be lower than that of other OECD countries, except the Czech Republic. The share of private transfers in the revenue of Portuguese NPIs (10 percent) is well below the 13-country average (22 percent), though this is inflated by 32 very high values for the developing countries—Brazil, Mozambique, and Thailand —but it is in line with the OECD average (11 percent). What is more, Portugal has an unusually large share of “other” revenue sources (19 percent vs. 3 percent average), which may contain different types of payments representing different revenue streams as well as statistical discrepancy. Due to data limitations, it is difficult to interpret this figure at this stage. Portugal’s Nonprofit Sector in Comparative Context • Page 15
. The release of the first NPI satellite account represents a milestone in putting non- CONCLUSIONprofit institutions on the economic map of Portugal. This breakthrough makes itpossible to relate the full NPI sector to other components of the Portuguese econ-omy in a systematic fashion and also to compare Portugal’s NPI sector to its coun-terparts in other parts of the world. Among other things, this report has revealed anonprofit sector that is larger than previously estimated, employs a significantnumber of paid workers, and generates its financial resources from a diverse rangeof sources and is thus not dependent on donations as a primary source of revenue.At the same time, perhaps reflecting the country’s long spell of authoritarian con-trol, the nonprofit sector of Portugal has yet to catch up to its counterparts in othercountries in aggregate scale, and lags behind other components of Portugueseeconomy in wage rates and in the overall level of resources it can command. Sharesof revenue computed against the base of nonprofit revenue thus probably exagge-rate the absolute extent of both government and philanthropic support.Though the Portuguese nonprofit sector has achieved an impressive scale meas-ured against where it stood when the Salazar regime ended, it is clear that it still hassome distance to go to catch up to its counterparts elsewhere in Europe. If this re-port and the data on which it is based help to put the sector’s achievements intocontext, but also stimulate its further development, it will have served its purposewell. Hopefully, future editions of the NPI satellite account will make it possible tokeep track of this future growth and development.P a g e 16 • Portugal’s Nonprofit Sector in Comparative Context
. APPENDIX APPENDIX 1: APPENDIX TABLE I Aggregate NPI Sector in Portugal, 2006 (SNA Basis) Data tables from the CODE TRANSACTION (THOUSANDS EURO) satellite account on I: Production account Uses Resources P.1 Output a/ 5 712 326 non-profit institutions P.11 Market output Of which: Third-party payments 1,351,671 in Portugal P.12 P.13 Output for own final use Other non-market output 37,323 4,323,332 P.2 Intermediate consumption 2,987,892 B.1g Value added, gross 2,724,434This Appendix presents the basic Satellite Account on K.1 Consumption of fixed capital 655,987 B.1n Value added, net 2,068,447Nonprofit Institutions in Portugal, embracing thefollowing SNA accounts: II.1.1: Generation of income account Uses Resources B.1n Value added, net 2,068,447 a) Production account D.1 Compensation of employees 2,716,172 D.11 Wages and salaries 2,228,443 b) Generation of income account D.12 Employers social contributions 487,729 c) Allocation of primary income account D.29 Other taxes on production 6,492 d) Secondary distribution of income account D.39 Other subsidies on production -442,169 B.2n Operating surplus, net -212,048 e) Use of income account f) Capital account II.1.2 Allocation of primary income account Uses Resources B.2n Operating surplus a/ -212,048 In addition, the table shows NPI employment distri- D.2 Taxes on production and imports 182,604 D.4 Property income 160,207 451,265 buted by economic activity groups as defined by the D.41 Interest 155,601 239,126 International Standard Industrial Classification. D.42 Distributed income of corporations 196,849 Groups with no NPI employment have been omitted. D.44 Property income attributed to insurance policy holders 3,462 D.45 Rent 4,606 11,828 B.5n Balance of primary incomes, net 261,614 II.2 Secondary distribution of income account Uses Resources B.5n Balance of primary incomes, net 261,614 D.5 Current taxes on income, wealth, etc. 9,967 0 D.6 Social contributions and benefits 72,433 67,040 D.7 Other current transfers 70,913 2,339,681 Private philanthropy Government grants and transfers Foreign grants and transfers B.6n Disposable income, net 2,515,022 II.3 Redistribution of income in kind account Uses Resources B.6n Disposable income, net 2,515,022 D.63 Social transfers in kind 3,140,895 B.7n Adjusted disposable income, net -625,873 II.4.1 Use of disposable income account Uses Resources B.6n Disposable income, net 2,515,022 P.3 Final consumption expenditure 3,222,415 B.8n Saving, net -707,393 Portugal’s Nonprofit Sector in Comparative Context • Page 17
. II.4.2 Use of adjusted disposable income account Uses Resources B.7n Adjusted disposable income, net -625,873 P.4 Actual final consumption 81,520 B.8n Saving, net -707,393 III.1 Capital account Uses Resources B.8n Saving, net -707,393 P.5 Gross capital formation 878,851 P.51 Gross fixed capital formation 884,703 P.52 Changes in inventories -9,012 P.53 Acquisitions less disposals of valuables 3,160 K.1 Consumption of fixed capital -655,987 K.2 Acquisitions less disposals of non-produced non- 14,597 financial assets D.9 Capital transfers, receivable 341,156 Private philanthropy Government grants and transfers Foreign grants and transfers D.9 Capital transfers, payable (–) -3,210 Private philanthropy Government grants and transfers Foreign grants and transfers B.9 Net lending (+) / net borrowing (–) -606,908 B.10.1 Changes in net worth due to saving and capital -369,447 transfers CODE EMPLOYMENT BY INDUSTRY* THOUSANDS Total 184,660 A Agriculture, hunting, forestry and fishing 316 C Manufacturing 285 D Electricity, gas and water supply 1 E Water, sewerage, waste management and remediation activities 36 F Construction 761 G Wholesale and retail trade, repair of motor vehicles and motorcycles 379 H Transportation and storage 15 I Accommodation and food service activities 1,439 J Publishing, audiovisual, broadcasting activities and telecommunications 122 K Financial and insurance activities 127 L Real estate activities 166 M Business activities, scientific research and development 2,919 N Administrative and support service activities 381 O Public administration and defense; compulsory social security 9,355 P Education 20,422 Q Human health services and social work 109,691 86 Human health services 13,391 87 Social work with accommodation 39,112 88 Social work without accommodation 57,188 R Arts, entertainment and recreation 7,083 90 Theater, music, dance, and other artistic and literary activities 936 91 Libraries, archives, museums, and other cultural activities 239 932 Entertainment and recreation activities 997 S Other services activities 31,162 * Classified by International Standard Industrial Classification. 94 Activities of membership organizations 28,912 Source: INE 96 Other personal service activities 2,250P a g e 18 • Portugal’s Nonprofit Sector in Comparative Context
. APPENDIX 2: Defining the nonprofit sector in Portugal A.2.1 • Current SNA treatment of the NPI sector The basic conceptual framework of the UN NPI Handbook methodology, outlined in FIGURE A2.1, calls for identifying those NPIs classified in each of the four institutional sectors of the national economy (non-financial corporations, financial corporations, government, and households) and then producing a separate set of tabulations on the aggregate dimensions of the compiled NPI units. These aggregate dimensions include standard data elements as defined in the 1993 SNA, as well as a few data elements that are of particular relevance to NPIs. A.2.2 • UN NPI Handbook definition of an NPI The first task for INE in compiling the NPI satellite account in Portugal was to identify the universe of organizations considered part of the nonprofit sector to be included in the NPI satellite account. To do so, the UN NPI Handbook identifies five characteristics that an institutional unit must meet to qualify as an NPI. These characteristics are briefly described in the paragraphs that follow: a) Organized. The entity must demonstrate some institutional reality, as evinced by “some degree of SECTORS OF THE SNA SYSTEM internal organizational structure; persistence of goals, structure, and activities; meaningful organizational Nonfinancial Financial General House- NPISH TYPE OF boundaries; or a legal charter of incorporation. Excluded Corporations Corporations Government holds Sector INSTITU- Sector Sector Sector Sector are purely ad hoc and temporary gatherings of people TIONAL S.11 S.12 S.13 S.14 S.15 with no real structure or organizational identity.” UNIT b) Not-for-profit. An NPI is an organization that does notCorporations C1 C2 exist primarily to generate profits, either directly or indirectly, and are not primarily guided by commercialGovernmentunits G goals and considerations. NPIs may accumulate surplus, but any such surplus must be plowed back into the basicHouseholds H mission of the agency, not distributed to the organizations’ owners, members, founders or governingNonprofit N1 N2 N3 N4 N5 board. In this sense, NPIs may be profit-making but theyinstitutions are “non-profit-distributing,” which differentiates NPIs from for-profit businesses. c) Institutionally separate from government. An NPI is not part of the apparatus of government and does not exercise governmental authority in its own right. The organization may receive significant financial support from government, and it may have public officials on its board. However, it has sufficient discretion with regard to the management of both its production and its use of funds than its operating and financing activities cannot be fully integrated with government finances in practice. d) Self-governing. An NPI must be able to control its own activities and is not under the effective control of any other entity. To be considered self-governing, the organization must control its management and operations to a significant extent, have its own internal governance procedures, and enjoy a meaningful degree of autonomy. e) Non-compulsory. Membership in and contributions of time and money to an NPI are not required or enforced by law or otherwise made a condition of citizenship. Portugal’s Nonprofit Sector in Comparative Context • Page 19