Download
1 / 7
80 likes | 151 Vues
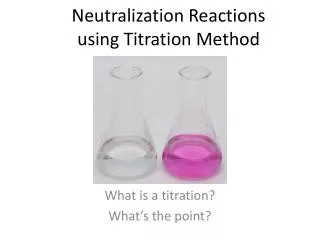
Due to rich medicinal values of tannin containing drugs, the utility and exploitation to adulterations becomes more. So there is an urge need to standardize the marketed preparations.<br>Here we have selected for our study some important ayurvedic drugs like harde and bahera which is available in the form of churna .There are many sophisticated methods available for<br>the standardization of tannins and polyphenolic compounds ,even though the conventional method plays more importance. Here we developed and validated simple redox titration method with little modification in house for the standardization of harde and bahera as first of its kind. This would be highly useful and beneficiary to any small scale companies who produce these two drugs as formulations either in traditional way or as an herbal dosage forms. This method will overcome as well to replace the hurdles existed in the advanced methods for any ayurvedic herbal companies. As per our knowledge this method is not yet reported. The results were shown for accuracy 98.48% ± 0.40 up to 100.84% ± 0.32, the quantification limit shown best if sampled above 2 gm (% C.V shows ≤ 1.5 ) incase Sample taken from actual procedure(from less ≤ 20 times the % C.V shows 2.81) and this method also shows good reproducibility and<br>repeatability result. The randomized Sample-2 of both harde and bahera churna shows the results in specified range of 32.0 to 49.0% and 20 to 30 % w/w respectively content of tannins given in the references. <br>

E N D
Available online www.jocpr.com Journal of Chemical and Pharmaceutical Research __________________________________________________ J. Chem. Pharm. Res., 2011, 3(6):293-299 ISSN No: 0975-7384 CODEN(USA): JCPRC5 Validated simple redox titration method for the estimation of gallotannins in marketed ayurvedic churna preparations Ankit V. Patel*, Kalpen N. Patel and Maulika S. Patel Department of Pharmaceutical Analysis, Shree Krishna Institute of Pharmacy College, At- Shankhalpur, Bechraji, Mehsana ______________________________________________________________________________ ABSTRACT Due to rich medicinal values of tannin containing drugs, the utility and exploitation to adulterations becomes more. So there is an urge need to standardize the marketed preparations. Here we have selected for our study some important ayurvedic drugs like harde and bahera which is available in the form of churna .There are many sophisticated methods available for the standardization of tannins and polyphenolic compounds ,even though the conventional method plays more importance. Here we developed and validated simple redox titration method with little modification in house for the standardization of harde and bahera as first of its kind. This would be highly useful and beneficiary to any small scale companies who produce these two drugs as formulations either in traditional way or as an herbal dosage forms. This method will overcome as well to replace the hurdles existed in the advanced methods for any ayurvedic herbal companies. As per our knowledge this method is not yet reported. The results were shown for accuracy 98.48% ± 0.40 up to 100.84% ± 0.32, the quantification limit shown best if sampled above 2 gm (% C.V shows ≤ 1.5 ) incase Sample taken from actual procedure(from less ≤ 20 times the % C.V shows 2.81) and this method also shows good reproducibility and repeatability result. The randomized Sample-2 of both harde and bahera churna shows the results in specified range of 32.0 to 49.0% and 20 to 30 % w/w respectively content of tannins given in the references. Keywords: Terminalia chebula, Chebulic myrobalam, Gallotannins, Hydrolysable Polyphenols, Anthracene derivative. ______________________________________________________________________________ INTRODUCTION Terminalia chebula commonly called as Haritaki belongs to family Combretaceae it is one of the traditional drug widely used in India. The activities of harde fruit are astringent, laxative, anthelmintic, stomachic and tonic. The laxative property is due to anthracene derivative present 293
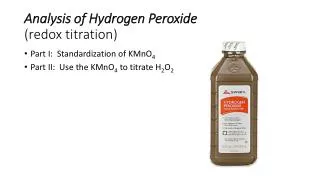
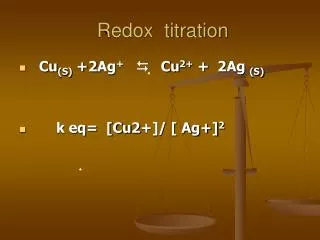
Ankit V. Patel et al ______________________________________________________________________________ J. Chem. Pharm. Res., 2011, 3(6):293-299 in the pericarp of the fruit pulp it’s also used to cure bleeding. It is the active ingredient of ayurvedic preparation ‘Triphala’ used in treatment of variety of ailments. Commercially it is used in dyeing and tanning industry and also in treatment of water used for locomotives [1].It is also used in treatment of piles and external ulcers. The harde fruit do not contain more than 2.0% of foreign organic matter and 6.0% total Ash content not less than 35.0% of ethanol soluble extractive and 50.0% of water soluble extractive values [2].The fruits are hard and stony with single seed which is light yellow in colour and 15 to 320 mm in length. The pulp of the fruit should not adherent to seed. Chebulic myrobalam, harde is the synonyms of herb drug. Myrobalam tree is found in sub-Himalaya tracks from Ravi to West Bengal, Assam and in all deciduous forests of India. Specifically in Madhya Pradesh, Bihar and Assam1.As per the literature we reviewed many of the estimation work carried out by various analytical methods from Spectrophotometer, HPLC and HPTLC. Chromatographic technique given in IP 2007 is only for chebulic acid1; Harde contains 32.0 to 49.0% tannins, 16.0 to 18.0% non tannins [3]. Terminalia belerica Linn commonly called as Baheda belongs to family Combretaceae .It is also one of the traditional drugs widely used in India. Baheda is used as an astringent and in the treatment of dyspepsia and diarrhoea. It is also a constituent of “Triphala churana”. The purgative property of half ripe fruit is due to the presence of fixed oil. The oil on hydrolysis yields an irritant recipe. Gum is used as a demulcent and purgative. Oil is used for the manufacturing of soap. The fruits contain about 20 to 30% of tannins and 40 to 45% water soluble extractives. It also contains coloring matter. It contains gallic acid, ellagic acid, phyllemblin, and ethyl gallate and galloy glucose. The plant produces a gum. It also contains most of the sugars as reported in myrobalam. The tree is found in all decidous forests of India, up to an altitude of 1000 m. It is found in abundance in Madhya Pradesh, Uttar Pradesh, Punjab, Maharashtra and also in Sri Lanka and Malaya [1]. One of the major causes of death across the world has been determined as cancer over the past decades. The best way to protect from cancer is to prevent it before it starts, which can be possible by modulation of dietary factors. Phenolic compounds, abundant in vegetables and fruits ubiquitous in diet, were described to play an important role as chemo preventive agents. Here we have taken the chance to study the quality of marketed preparations by mean of Redox titration [4]. EXPERIMENTAL SECTION Samples were procured from market in randomized way, for Harde (three samples) and for Bahera (two samples). Sample-1 from ZANDU Pharmaceutical limited, G.I.D.C, Plot NO 82, and VAPI-396195, Gujarat, India. Sample-2 from Shri Bhuvaneshwari ,Aushadhashram, No 2- mahadevwadi, Gondal -360311, Gujarat, India.Sample-3 fromAkhand Ayurved Sevashram 48,Calico Nagar co-op house. Soc. Narol Sarkhej by pass B/H Wilsom hotel, Narol , Ahmedabad-382405, Gujarat, India .Here all the glassware’s which are used in experiments all are borosilicate .we use double distilled water, reagents, chemicals and solvents all were analytical grade . Preparation of reagents [5] For the preparation of 0.1N KmnO4, weigh 3.14 gm of KmnO4 in 100ml and make the volume up to 1000ml with distilled water. Indigo Carmine solution was used as an indicator by taking 0.04gm indigo carmine powder in 250 ml volumetric flask add 2ml of conc. HCl add make up to 200ml with 20% H2SO4. For the preparation of 0.1N Oxalic acids weigh 0.63 gm oxalic acid in 250ml beaker and add 100ml distilled water in it. 294
Ankit V. Patel et al ______________________________________________________________________________ J. Chem. Pharm. Res., 2011, 3(6):293-299 Standardization of 0.1N KmnO4 [5] Take 10ml oxalic acid solution in 250ml of conical flask and add 20 ml of distilled water in it and add 2ml of conc. H2SO4 .Heat this mixture on water bath for 15-20 minute at 70oc. After heating on water bath this solution is to be titrating against 0.1N KMnO4 solution. KMnO4 is act as self indicator and shows light pink colour at end point. Preparation of extract from marketed samples [6] Here little modification has done in the existing protocol. Weigh 2gm of sample powder accurately and pour in to 250ml conical flask and add 100ml distilled water in it and heat on water bath for 15 min at 70oc. Filter this extract and re-extract powder in another 100ml of distilled water at the same condition and filter the solution. Combine the filtrate and make the volume up to 250 ml and consider this solution as primary stock solution for the estimation as well replicate results. Quantitative Estimation of tannin (gallotannic acid) [6] Pipette out 10ml from the stock solution and add 10ml indigo carmine indicator solution and make up volume up to 100ml with distilled water. Heat this solution on water bath for 15-20 min at 70oc and titrated against 0.1N KMnO4 solution which has taken in burette. Note the Colour changes from blue to parrot green and finally the appearance of golden yellow color at end point. The consumed volume of 0.1N KMnO4 is recorded as A. Take another 2 reading using same procedure and take mean out of that. Blank reading taken by replacing sample solution with distilled water and follow the same procedure as above. Note down the ml of KMnO4 is used in blank as B %Tannins = (A - B)*250 *100*(0.00425 gm tannins/ml of 0.1N KMnO4) gm of sample powder * ml of sample taken Method Validation [7] Analytical Procedure The analytical procedure refers to the way of performing the analysis. It should describe in detail the steps necessary to perform each analytical test. This may include but is not limited to the sample, the reference standard and the reagents preparations, use of the apparatus, use of the formulae for the calculation and etc. Specificity Specificity is the ability to assess unequivocally the analyte in the presence of components which may be expected to be present. Assay (content or potency): to provide an exact result which allows an accurate statement on the content or potency of the analyte in a sample. Accuracy The accuracy of an analytical procedure expresses the closeness of agreement between the value which is accepted either as a conventional true value or an accepted reference value and the value found. This is sometimes termed trueness. Precision The precision of an analytical procedure expresses the closeness of agreement (degree of Scatter) between a series of measurements obtained from multiple sampling of the same homogeneous sample under the prescribed conditions. Precision may be considered at three levels: repeatability, intermediate precision and reproducibility. Precision should be investigated using homogeneous, authentic samples. However, if it is not possible to obtain a homogeneous sample 295
Ankit V. Patel et al ______________________________________________________________________________ J. Chem. Pharm. Res., 2011, 3(6):293-299 it may be investigated using artificially prepared samples or a sample solution. The precision of an analytical procedure is usually expressed as the variance, standard deviation or coefficient of variation of a series of measurements. Quantitation Limit The quantitation limit of an individual analytical procedure is the lowest amount of analyte in a sample which can be quantitatively determined with suitable precision and accuracy. The quantitation limit is a parameter of quantitative assays for low levels of compounds in sample matrices, and is used particularly for the determination of impurities and/or degradation products. Range for Estimation The range of an analytical procedure is the interval between the upper and lower concentration (amounts) of analyte in the sample (including these concentrations) for which it has been demonstrated that the analytical procedure has a suitable level of precision, accuracy and linearity. RESULTS AND DISCUSSION In most of the places for the validation methods of our present work the sample 2 has been considered in common and irrespective to any bias for sampling .Results of Trails conducted for the marketed samples (Harde) given in (Table 1), Results of Trails conducted for the marketed samples (Baheda) given in (Table 2), Results of Limit of quantification and its variations given in (Table 3) Assay results of marketed Churna samples given in (Table 4) Results of Repeatability and reproducibility given in (Table 5) Recovery studies for accuracy given in (Table 6).It is known that approximately 90 % of human cancer is due to environmental chemicals. In this concept, tannic acid, hydrolysable polyphenols produced from the secondary metabolism of plants, passes one step further due to its ability to modulate Phase I and Phase II enzymes4 .There is an inverse correlation between individuals who consume a diet rich in fruits and vegetables and their risk in developing cancers [8, 9]. It was shown that stomach cancer incidence was significantly decreased with tea consumption [10, 11]. Moreover oral consumption of green tea decrease tumor size in papilloma-bearing mice and also inhibits N- nitrosodimethylamine (NDMA)-induced tumorigenesis [12, 13]. The inhibitory effect of tannins has been shown to be due to the reduction of enzyme activity, dysfunctioning of cell membrane and deprivation of substrate metal ions and minerals [14]. Owing to all these significant importance as well rich in medicinal values of tannin containing drugs, the utility and exploitation of adulterations becomes rapidly. So the present results would help the analyst in the industries. Table 1: Results of Trails conducted for the marketed samples (Harde) Sample-1 ( wt in mg) in mg) (wt in mg) Trail -I 875 858 667 Trail -2 865 869 678 Trail -3 887 844 658 Mean 875.67 857 667.67 S.D 8.99 10.23 8.18 %C.V 1.03 1.19 1.22 Sample -2 (wt Sample-3 Sample-1 (%w/w) 43.75 43.25 43.85 43.62 0.26 0.60 Sample -2 (%w/w) 42.9 43.45 42.2 42.85 0.51 1.19 Sample-3 (%w/w) 33.35 33.9 32.9 33.38 0.41 1.22 Harde 296
Ankit V. Patel et al ______________________________________________________________________________ J. Chem. Pharm. Res., 2011, 3(6):293-299 Table 2: Results of Trails conducted for the marketed samples (Baheda) Sample-2 ( wt in mg) (wt in mg) 480 307 472 316 486 314 479.33 312.33 5.73 3.86 1.20 1.24 Sample -3 Sample-2 ( %w/w) 24 23.6 24.3 23.97 0.29 1.20 Baheda Sample -3 (%w/w) Trail -I Trail -2 Trail -3 Mean S.D %C.V 15.35 15.8 15.7 15.62 0.19 1.24 Table 3: Results of Limit of quantification and its variations Sample taken from actual procedure(in times less or more ) (in mg) ≤ 20 100 ≤ 10 200 ≥ 2 4000 ≤ 20 100 ≤ 10 200 ≥ 2 4000 Amount of sample taken Average wt. expressed in mg ± S.D 44.33±1.24 87.67±1.25 1728.67±4.92 22.66±1.24 43.33±1.24 996±4.082 Marketed Harde sample Assay value in %w/w ± S.D % C.V Harde Sample -2 Baheda Sample-2 44.33±1.24 43.83±1.42 43.21±0,12 22.66±1.24 23.66±0.62 24.89±0.094 2.81 1.42 0.28 5.5 2.63 0.37 Table: 4 Assay results of marketed Churna samples Assay value in %w/w ± S.D 43.62 ± 0.26 42.85 ± 0.51 33.38 ± 0.41 Assay value in %w/w ± S.D 23.97 ± 0.29 15.62 ± 0.19 Marketed Harde sample Average wt. expressed in mg ± S.D % C.V Sample-1 Sample-2 Sample-3 875.67 ± 8.99 875 ± 10.23 667.67 ± 8.18 0.60 1.19 1.22 Marketed Baheda Sample Average wt. expressed in mg ± S.D % C.V Sample-2 Sample-3 479.33 ± 5.37 312.33 ± 3.86 1.20 1.24 Results were expressed as mean ± S.D (n=3) Table 5: Results of Repeatability and reproducibility Average wt. expressed in mg ± S.D Intraday 865 ± 5.89 472 ± 3.27 Interday 867 ± 4.74 456.67 ± 5.44 Results were expressed as mean ± S.D (n=3) Table 6: Recovery studies for accuracy (Harde Sample-2) Addition of std Gallic acid (in mg) present (in mg) 88 (40%) 308 132 (60%) 352 176 (80%) 396 Results were expressed as mean ± S.D (n=3) Assay value in %w/w ± S.D Marketed Sample % C.V Hardae (Sample-2) Baheda (Sample-2) 43.25 ± 0.29 23.6 ± 0.16 0.68 0.69 Hardae (Sample-2) Baheda (Sample-2) 43.35 ± 0.19 22.83 ± 0.27 0.43 1.19 Content present in 500mg sample powder(in mg) 220 220 220 Actual amount Should be Recovery shows in mg ± S.D % recovery ± S.D 303.33 ± 1.24 352.66 ± 1.25 399.34 ± 1.25 98.48% ± 0.40 98.39% ± 0.35 100.84% ± 0.32 297
Ankit V. Patel et al ______________________________________________________________________________ J. Chem. Pharm. Res., 2011, 3(6):293-299 CONCLUSION Tannic acid was suggested to be anticarcinogenic [15]. Variety of edible vegetables and fruits possess tannic acid such as sorghum, grapes, strawberries lotus, nut wines and tea [16, 19].So there is an urge need to standardize the marketed preparations contains tannin drug that includes harde and bahera in form of chruna , here we have taken the chance to control the quality of marketed preparations by mean of Redox titration ,it may be very useful to the small scale herbal companies for the routine quality analysis before it goes to the market .As per our knowledge this kind of method is not yet reported in any article. This method will overcome as well the replace the hurdles existed in the advanced methods for any ayurvedic companies. Since humans are exposed to tannic acid, gallic acid in their diet, it is important to understand its toxicological functions as far safety is concerned. Still more of research work can be done in this direction. Acknowledgment I wish to express my sincere thanks to the management of SKIP, Becharaji, Mehsana, Gujarat, for providing me the necessary support to carry out my research work. REFERENCES [1]A Text book of Pharmacognosy by C. K. Kokate, S.B, Gokhale, A.P.Purohit, 32th edition Nirali Prakashan 2007 Page no. 259 - 261 [2]Indian Pharmacopeia edition 2007 ,volume 3, page 2042 [3]Tannins and its analytical techniques K. Ramakrishnan, S.R.Selvi and Subha.R Department of chemical engigeering S.T.I Tumbur 572103, Chemical chemical Engr. Section-A vol-48 No 2 April – june 2006. [4]The effects of phenolic compound Tannic acid on Phase 2 and cytocrome P450 dependent enzyme in rabbit liver and kidney, Serdan KARAKURT, A graduate school of natural and applied sciences of Middle east Techanical University. [5]Pharmaceutical grug analysis by Ashutosh Kar 2nd edition 2008, New age international publication Page no. 35, 127 [6]The study of antioxidant capacity in various parts of Areca catechu L. Department of Pharmacognosy, Faculty of Pharmacy, Silpakorn University, Nakhon-Pathon 73000, Thailand. [7]ICH Topics Q2 (R1) Validation and Analytical procedure Text and Methadology june 1995 CPMP/ICH/381/95. 7 Westferry Circus, Canary Wharf, London, E14 4HB, UK. [8]Stich, 1984 Naturally occurring phenolics as antimutagenic and anticarcinogenic agent. Nutritional and ToxicologicalAspects of Food Safety, Friedman, W., Ed., Adv. Exp. Med. Biol., Vol. 177, pp. 1. [9]Stoner G. D., (1989). Proceedings of the Annual Meeting of the North America Strawberry Growers Association, Grand Rapids, Michigan, [10]Stocks P., (1970). Br. J. Cancer, Vol. 24, pp. 215 [11]Oguni I., Nasu K., Yamamoto S., and Nomura T., (1988). Agric. Biol. Chem., Vol. 52, pp. 1879. [12] Conney et al., 1992;Inhibitory effect of green tea on tumorigenesis and tumor growth in mouse skin. Phenolic Compounds in Food and Their Effects on Health. II.Antioxidants and Cancer C. Y., Eds., American ChemicalSociety, Washington, D.C., pp. 284. [13]Wang et al., 1993 Inhibition of nitrosamine-induced tumorigenesis by green tea and black tea. Phenolic Compounds in Food and Their Effects on Health. II. Antioxidants and Cancer 298
Ankit V. Patel et al ______________________________________________________________________________ J. Chem. Pharm. Res., 2011, 3(6):293-299 Prevention. Chapter 22, ACS Symposium Series 507, Huang, M.-T., Ho C.-T., and Lee, C. Y., Eds., American ChemicalSociety, Washington, D.C., pp. 293. [14]Goel et al., 2005Naturwissenschaften, Vol. 92, pp. 497-503. [15] Chunk et al., 1998Crit Rev Food Sci Nutr., Vol.38, pp.421-464. [16] Goldstein; 1963; Phytochemistry. Vol. 2, pp. 371. [17]Sanderson et al., 1975; Contributions of polyphenolic compounds to thetaste of tea. Phenolic Sulfur and Nitrogen Compounds in Food Flavours. ACS Symp. Ser. 26, Charalambous, G. and Katz, I., Eds.,American Chemical Society, Washington, D.C., [18] Chavan et al., 1977;) Res. Bull. MAU, Parbhani, India, Vol. 1, pp. 88. [19] Salunkhe et al., 1982, Alcohol Clin. Exp. Res., Vol. 22, pp. 2125-2132 299