Download
1 / 16
160 likes | 280 Vues
TDAQ Experience in the BNL Liquid Argon Calorimeter Test Facility. Denis Oliveira Damazio (BNL), George Redlinger (BNL). Objectives. To use TDAQ Online Software during calibration tests in the BNL Facility. To be able to integrate the many processes used into just one easy-to-use framework.

E N D
TDAQ Experience in the BNL Liquid Argon Calorimeter Test Facility Denis Oliveira Damazio (BNL), George Redlinger (BNL).
Objectives • To use TDAQ Online Software during calibration tests in the BNL Facility. • To be able to integrate the many processes used into just one easy-to-use framework. • To develop software that can be used in future tests in Building 180 and beam tests. • To monitor important variables of the system while running. • To produce multiple runs with minor calibration parameters change (eg. : DAC, Delay).
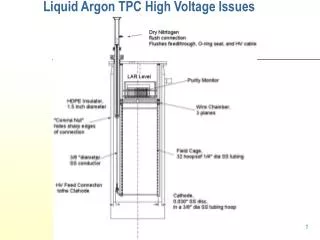
System Description • A PC, running Linux, controls the whole system. • Access to the Feb Crate is performed via a BIT3 and a SPAC modules. • Data is sent to the ROD Crate through optical connection. • TTCvi, PTG and GPIB modules are also controlled from the PC. • Three control processes are required : One for the Febs, one for the VME Crate and a last one for the ROD.
TDAQ Online Software Interface • Using some basic TDAQ Online Software examples, it is possible to control, report status, permanent/temporary store configuration data. • A user friendly graphical interface can be used to coordinate all the systems while presenting important status information.
TDAQ Online Software Components Used • The Controllers for the Crates are State Machines (initial, loaded, configured and run states) synchronized with a Root Controller. • The controllers can intercommunicate with other Online Software components in a transparent way from the software design point of view. • They must handle the hardware and report problems.
TDAQ Online Software Components Used • A XML database define all the software structure, including controllers, other software entities, parameters and machines. Also, hardware parts and parameters (eg: VME addresses) can be defined. • In the figure, one can see the detector with its many crates and modules in a visual database editor. • The database is loaded by the controllers by the load action in the Online Software graphical interface panel. • An Information Service (IS) can handle part of the data in order to allow runtime configuration changes. This configuration should be passed to hardware in the CONFIG action.
TDAQ Online Software Components Used • Finally, in the RUN action the controllers should perform hardware status checking and report, through the Message Report System (MRS), any problem. • A java Graphical User Interface allows the user to receive MRS messages and change configuration running parameters. • The information is exchanged between the Java Panels and the C++ code through IS. • Part of this information can be Online BookKept (OBK).
Online Software Components being used. • The Root Controller is a default requirement in the Online Software Environment. • The Other controllers operate in synchrony taking care of specific parts of the system. • The exchange of information is constant but, of course, not at the data acquisition rate. • Every important detail may be publish in the GUI through MRS calls.
Online Software already running • This is the Online Software GUI. • Note the Controllers in the middle of the screen. • Note the State Machine buttons in the left frame. • Check the MRS window in the bottom of the screen. • The system was able to run, however, data produced is being checked now.
Online Software already running • This is one added panel with the parameters to be sent to the Febs. • Some parameters are global, such as the number of samples. • Others are specific for each Feb, such as Shaper Mask. • The parameters were checked in the Febs and their download is being performed correctly.
Online Software already running • java panels were developed for the VME and ROD Controllers. The Calibration board is configurable also.
Online Software monitoring • The Online Software has an interface to a monitoring system. • A data sampler and a data displayer were developed for monitoring Febs temperatures, voltages, etc. • The results are stored as ROOT histograms for offline checking. • Although this was an important experiment, the variables chosen should be handled by DCS – PVSS.
Online BookKeeper (OBK) • OBK can store assigned IS information (calibration, # of events, for instance) and MRS (Status of the hardware, operation of the controllers) in a database. • The database can be created using Objectivity, MySQL and Object Kernel Service (OKS). The last one was chosen for this test. • Our runs in BNL are being automatically displayed on the web, directly from the database. Check it in http://larg-fect.usatlas.bnl.gov/cgi-bin/obk_dump_oks.php4. • Integration between this info and data access could also be envisaged.
Conclusion and Next Goals • The system using TDAQ Online Software is now running in the Liquid Argon Calorimeter Facility at BNL. • Runs using all the described components are about to be tested. Every component should be directly controlled through the TDAQ/OS Graphical User Interface. • Calibration boards and Tower Builder boards also included in the framework.
Conclusion and Next Goals • A monitoring system to accumulate data from the Febs (temperatures, voltages, etc) and display it as ROOT histograms was also developed. This could be integrated in the DCS framework. • Since monitoring may create extra noise in the Feb bus, noise studies must be carried out. • The OS/OBK is also installed and running for the BNL setup. The database with all the running parameters is available online. A complete parameter description is, however, missing.
Conclusion and Next Goals • A script to provide small changes whilst executing many runs with different calibration (Dac, Delay) is also available. • DataFlow integration is also being envisaged. • The software developed so far may be useful in the Building 180 tests and also in the 2004 testbeam.