Download
1 / 20
200 likes | 205 Vues
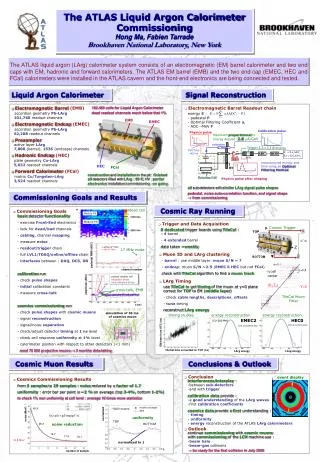
ATLAS Liquid Argon Forward Calorimeter Status of Calibration Test Beam Analysis. J. Rutherfoord 11 September 2002. Goals of Test Beam Run. Energy calibration of the FCal Edge scan at high | | Repeat HV cold test of last November.

E N D
ATLAS Liquid ArgonForward CalorimeterStatus of CalibrationTest Beam Analysis J. Rutherfoord 11 September 2002
Goals of Test Beam Run • Energy calibration of the FCal • Edge scan at high || • Repeat HV cold test of last November J. Rutherfoord
Instrumented Sections Limited due to availability of pigtails J. Rutherfoord
Simulated upstream material Beam hole thru FCal Beam spots for calibration Beam spots for edge scan FCal outer edge J. Rutherfoord
Display of Energy Deposits in FCal1, 2, and 3 due to 200 GeV ’s J. Rutherfoord
Fitting the pulse shape • SPICE models and reflections • Optimal filtering • Time resolution • What’s next? J. Rutherfoord
Data are points in black Vac & Ped Cables J. Rutherfoord
Unexpected reflection • Due to preamp input impedance? • About 4 larger than cable impedance • Consistent with pulser data • Ratio of response to pulser, without and with ped cables connected, should be 2.0 but is measured to be about 2.16 Preamp input Z Pulser Cold Cable J. Rutherfoord
Close-up of peak region J. Rutherfoord
TDC’s start on beam counter and stop on TTC stop on inverted TTC J. Rutherfoord
= 250 ps J. Rutherfoord
Electrons into FCal2 and FCal3 FCal3 FCal2 FCal1 Electron beam Evacuated “beam pipe” J. Rutherfoord
The signal Amplitude • Electronics Noise • Electron response • Hadron response J. Rutherfoord
Electronics noise in 1 of 8 FEBs Prediction is 3.3 ADC counts Unused channel J. Rutherfoord
Coherent Noise 11% 5.5% J. Rutherfoord
193.1 GeV Zpa=30 J. Rutherfoord
What’s next? • Improve SPICE model and • Better understand the pulse shape • Better understand the pulse amplitude • Improve timing resolution (correct for light transit time in scintillator) • Make optimal use of pulser data • Repeat the standard analyses we do with test beam data J. Rutherfoord