Download
1 / 20
200 likes | 357 Vues
SAISD 2003 - 2005 TAKS Performance. Board Work Session June 2005 Office of Research, Evaluation, and Assessment. Vision 2005 and Beyond Mission Statement.

E N D
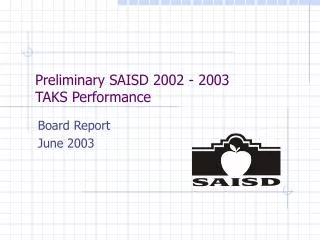
SAISD 2003 - 2005 TAKS Performance Board Work Session June 2005 Office of Research, Evaluation, and Assessment Preliminary Data: Not a Final Accountability Document
Vision 2005 and BeyondMission Statement The mission of the San Antonio Independent School District is to graduate all students as responsible citizens with the academic and social preparation to pursue higher education, join the military, or enter the workforce. Preliminary Data: Not a Final Accountability Document
SAISD Fundamental Beliefs • Excellence and equity in student performance are achievable for all students. • No child will be left behind. • The teacher is the program. • People support what they help create. • Change comes from within. Preliminary Data: Not a Final Accountability Document
District Functions • Governance • Teaching and Learning • Student Support • Administration • Human Resources • Technology • Communications • School-Community Relations • Special Facilities Construction and Improvement Preliminary Data: Not a Final Accountability Document
Elevating Assessment Standards: TAKS (Texas Assessment of Knowledge and Skills), SDAA II (State Developed Alternative Assessment II), and TELPAS (Texas English Language Proficiency Assessment System) • Texas is in year three of a phase-in program to transition to a more rigorous state test – TAKS. • In order to compare growth from one year to the next, the same performance standards need to be used. In 2005, except for Grade 11, we are at the standard originally intended by the State Board of Education. • The current year standard for grades 3 – 10 is known as “Panel Recommendation.” Grade 11 will be at this standard in 2006. All slides showing PR in this presentation, show 3 – 10 at PR and Grade 11 at 1 SEM (accountability standard). • The 2004 – 2005 school year was the first year for a newly developed State Developed Alternative Assessment II to measure the performance of students in special education receiving instruction below grade level or at grade level, but with needed modifications not permitted by TAKS. Preliminary Data: Not a Final Accountability Document
Elevating Assessment Standards: TAKS (Texas Assessment of Knowledge and Skills), SDAA II (State Developed Alternative Assessment II), and TELPAS (Texas English Language Proficiency Assessment System) • In order to meet the new federal requirements for English Language Learners called Annual Measurable Achievement Objectives (AMAOs), the state has developed a newTexas English Language Proficiency Assessment System (TELPAS). • Information on this system was presented to the Board in February of 2005. • In an effort to focus on state accountability in this presentation, we will address TAKS, SDAA II – only as it affects state accountability, and we will not address TELPAS in this report. • Later reports on federal accountability will address these mandates. Preliminary Data: Not a Final Accountability Document
Comparison Framework • The following slides show SAISD achievement across two years of TAKS. • The first slide in the series shows the growth measured at the same level of difficulty across two years. Last year’s scores were converted to the same standard as 2005. This is true growth – “apples to apples.” • The second slide in the series shows the growth measured against the state. Are we making disproportionate gain? How much greater is our gain than state gain? At grade 5 State and District gain is measured for the first administration only, because the figures for the second administration were not yet available at the State level. Preliminary Data: Not a Final Accountability Document
2003 - 2005 SAISD TAKS Reading Grades 3- 11*Growth by Panel Recommendation +7 +7 +8 +7 +6 +9 +8 +7 +4 +4 *Grade 11 at 1SEM. Preliminary Data: Not a Final Accountability Document
Reading: Comparison of District to State Pluses Indicate Closing of the Gap + + + + + + + + + + Preliminary Data: Not a Final Accountability Document
2003 – 2005 SAISD TAKS Math Grades 3- 11* at Panel Recommendation +12 +5 +13 +5 +13 +3 +13 +5 +13 NC *Grade 11 at 1 SEM Preliminary Data: Not a Final Accountability Document
Math: Comparison of District to State Pluses Indicate Closing of the Gap - - + - + + - - - - Preliminary Data: Not a Final Accountability Document
2003 – 2005 SAISD TAKS Writing Grades 4, 7 at Panel Recommendation +12 +6 +13 +6 +8 +11 +13 +6 +8 +9 Preliminary Data: Not a Final Accountability Document
Writing: Comparison of District to State Pluses Indicate Closing of the Gap + + + Preliminary Data: Not a Final Accountability Document
2003 – 2005 SAISD TAKS Science Grades 5, 10, 11* at Panel Recommendation +18 +7 +18 +8 +18 +8 +17 +8 +17 +5 Grade 11 at 1 SEM Preliminary Data: Not a Final Accountability Document
Science: Comparison of District to State Pluses Indicate Closing of the Gap + + + + Preliminary Data: Not a Final Accountability Document
2003 - 2005 SAISD TAKS Social Studies Grades 8, 10, 11* at Panel Recommendation +9 +4 +10 +3 +14 -1 +10 +4 +5 -1 *Grade 11 at 1 SEM Preliminary Data: Not a Final Accountability Document
Social Studies: Comparison of District to StatePluses Indicate Closing of the Gap + + - + Preliminary Data: Not a Final Accountability Document
SDAA II: District Accountability Note: Preliminary Accountability Subset is used. Preliminary Data: Not a Final Accountability Document
Summary of District Gains/Losses Compared to State • In 90% of measures, the District gain surpassed state gain (74%) or was within 3.5 percentage points of state gain (16%). • The State made gain in only 24 measures total (77%), while the District made gain in 28 of the 31 measures (90%). Preliminary Data: Not a Final Accountability Document
TAKS 2004 - 2005 • The District made gains during the 2004-2005 school year even with the substantial elevation of standards. • Planning for the new school year will address areas revealed by this analysis. • Programs are under review for needed changes during the coming year. Substantive gain continues and we are “Proud to be in SAISD.” Preliminary Data: Not a Final Accountability Document