Download
1 / 36
360 likes | 453 Vues
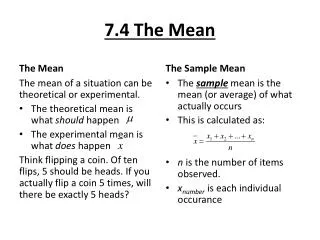
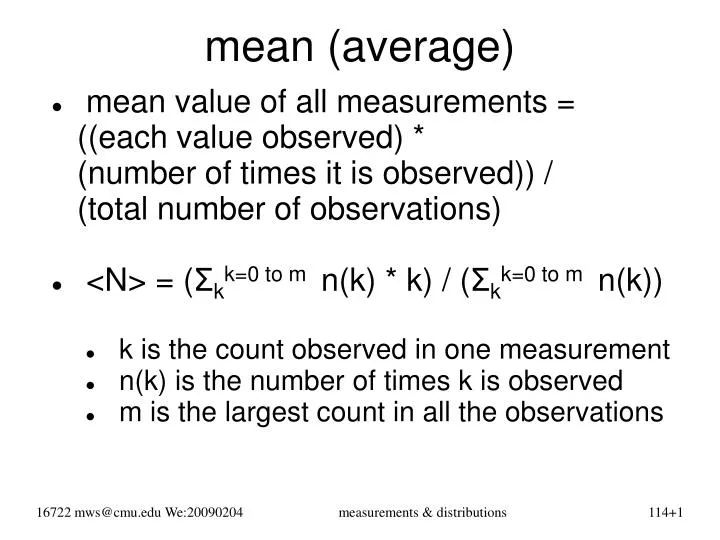
mean (average). mean value of all measurements = ((each value observed) * (number of times it is observed)) / (total number of observations) <N> = ( Σ k k=0 to m n(k) * k) / ( Σ k k=0 to m n(k)) k is the count observed in one measurement n(k) is the number of times k is observed

E N D
measurements & distributions mean (average) • mean value of all measurements =((each value observed) *(number of times it is observed)) / (total number of observations) • <N> = (Σkk=0 to m n(k) * k) / (Σkk=0 to m n(k)) • k is the count observed in one measurement • n(k) is the number of times k is observed • m is the largest count in all the observations
measurements & distributions width – standard deviation • the most common measure of a distribution’s width is its “standard deviation”: the RMS value (σ) of the deviation of each of the measurements from the mean of all the measurements • σ2= (Σkk=0 to m n(k) * (k - <N>)2) / (Σkk=0 to n n(k))(for a counting measurement in which each outcome is an integer; for continuous outcomes you need to replace this with an integral) • as we discussed, it is observed and provable that the standard deviation (σ) of a counting experiment whose mean is <N> is <N>1/2/2 • hmm ... should I subtract 1 from the denominator?
measurements & distributions shape: the Poisson distribution • if the average number of counts in repeated samples is <N> (also written N-overbar) then the probability of a particular experiment giving N counts is • remember that any sample N must be an integer • but if <N> happens to be an integer it is justa numerical accident ... you should expect<N> to be a “floating point” number
measurements & distributions Poisson distribution – origin 1 = p(0) + p(1) + p(2) + … + p(i) + …
measurements & distributions the key point to remember • it is a pervasive rule-of-thumb that in any measurement that can be traced to a counting process, the uncertainty in any particular count is the square root of the average number of counts observed over all the experiments • for a single counting experiment, your best guess for the uncertainty of the result is the square root of the result
measurements & distributions assignment (21) A set of counting measurements averages 1.3333... counts per sample; what are the probabilities of the next sample yielding 0, 1, 2, 3, 4, and 5 counts? (22) Think through and describe intuitively the distribution of counting measurement values whose mean is very small, say 0.01; show that your intuition is consistent with what you calculate using the Poisson distribution formula.
measurements & distributions distribution of measurementswhose outcome can take onany value
measurements & distributions there is no such thing ... • any real measurement is limited by the resolution of the instrument to a finite number of discrete outcomes • how finely are you willing to read the scale? • how many digits are there on the display? • what is the resolution of your computer’s ADC? • but we understand that certain measurements in principle take on a continuum of values • our experiments yield average values of that continuum over the resolution bandwidth
measurements & distributions Gaussian (“normal”) distribution
measurements & distributions • in practice measured values are constrained to certain discrete values that the instrument (or the person reading it) can assign • here the raw measurements are limited to exact steps and multiples of 0.1 mm(the red squares) • in a set of replicated measurements, each of these “quantized” values appears an integral number of times • in the actual finite-sized set of replicated measurements, statistical fluctuations are observed (the blue diamonds)
measurements & distributions Gaussian measurement model • in words: the probability of a measurement being between x-Δx/2 and x+Δx/2 is … • note: σ has the same units as x, i.e., millimeters • the distribution has its mean and peak at x = x0 • in this figure x0 = 1000 mm, σ = 0.5 mm • the Gaussian distribution is often a good model, particularly when the measurement scatter is “natural” vs. “technical”
measurements & distributions • the actual data (the blue diamonds) plus the model (the Gaussian function of mean x0 and standard deviation σ) plus an algorithm for (in some stated sense) minimizing the difference between them together allow you to estimate x0 (which you state as the outcome of your set of measurements) and σ (which you state as your estimate of the uncertainty of your outcome) • “estimating the parameters of the model”
measurements & distributions compare and contrastPoisson (counting)andGaussian (“normal”)distributions
measurements & distributions measurement whose outcome is an integer count (n)mean value of outcomes = 12.5 (your choice)standard deviation of outcomes = 12.51/2 (you have no choice) relativeprobability definedonly forinteger valuesof n measurement(n, mean x0)
measurements & distributions measurement x whose outcome is a continuum valuemean value of the continuum = 12.5 (your choice)standard deviation of outcomes = 12.51/2 (your choice) 1/2 it looks likethere is a dimensionalerror,but these are dimensionless counts,so it is okay measurement(n, mean x0)
measurements & distributions compare & contrast • visual examination shows that for <N> greater than about 10 the Poisson distribution is practically indistinguishable from the Gaussian distribution with mean <N> and standard deviation <N>1/21/2 • but be careful ... • the Gaussian distribution has two independent variables, the mean and the standard deviation (width) • the Poisson distribution has one independent variable, the mean; its standard deviation (width) is completely determined by its mean
measurements & distributions measurements with multiple sources of uncertaintyvs.multiple measurementsof the same quantity made bydifferent instrumentswith different uncertainties
measurements & distributions if you take away just one ... • … quantitative detail from this course,it should be that you know without stopping to think about it … • how to estimate the error in a measurement composed of measurements of several different quantities for each of which you have an error estimate … • how to combine separate measurements of the same quantity and estimate the error of their “fusion”
measurements & distributions combining multiple error sources • in complex measurements there are usually multiple sources of error or uncertainty • measure or estimate each contribution xi tothe combined measurement X(x1, x2, x3,...) • in the worst possible instance all contributions have the same sign; in the best instance the signs conspire to make the net error zero • in the statistically-typical case they combine with “random phase”, i.e., in quadrature:X= (x12 + x22 + x32 + …)½where xi = (∂X(x1, x2, x3,...)/∂xi) xi
measurements & distributions example: measure the volume of a box • V = (L +/- L) (W +/- W) (H +/- H)∂V/∂L = W H∂V/∂W = LH∂V/∂H = L W • V = ((W H L)2 + (L H W)2 + (L W H)2)1/2 • V/V = (L/L)2 + (W/W)2 + (H/H)2)1/2 • note: this ignores the possibility that the box’s angles are not precisely 90o; the formula for V should properly include the angles and the consequences of errors in their measurements
measurements & distributions what if the components have different dimensionality? • say you are given base area & height: V = (A +/- A) (H +/- H)∂V/∂A = H∂V/∂H = A • V = ((H A) 2 + (A H)2)1/2 • V/V = ((A/A) 2 + (H/H)2)1/2 • and if A = L WthenA = ((L W)2 + (W L)2)1/2soV = ((L W)2 + (W L)2 + (A H)2)1/2
measurements & distributions contrasting error propagationand sensor fusion • error propagation: when a single measurement has multiple error sources,the overall error estimate is(component_error_sources2)½ • the overall error estimate is (as you should expect) bigger than the biggest single error source • in practice the overall error estimate is often dominated by the biggest single error source
measurements & distributions • when multiple measurements are made of the same measurand using different instruments, their individual contributions are weighted by the reciprocals of the squares of their individual error estimates • the overall error estimate is smaller than the smallest individual error source • as you should naturally expect! • in practice the overall error estimate is often dominated by the smallest single error source • this is the most basic kind of “sensor fusion”
measurements & distributions example:multiple temperature measurements • three thermometers give measurements +/-1 T1 = 19.0 +/- 2.0 C T2 = 18.0 +/- 2.5 C T3 = 19.0 +/- 1.0 C • what is your best estimate of the actual temperature, and what is your estimate of theerror in your estimate of the actual temperature?
measurements & distributions • weight each measurement by its “goodness”, i.e., the reciprocal of square of its error estimate:T = ( Ti/i2 ) / ( 1/i2)= (19./2.2 +18./2.52 +19./1.2)/(1/2.2 +1/2.52 +1/1.2)= 18.89 C • i-2)-1/2 = 0.84 C • as expected, the error estimated for the combined measurement estimate is smaller than any of the individual errors • as expected, the combined measurement estimate is close to the best individual measurement
measurements & distributions reminder • make sure this is so clear to you that you never have to think about it twice: • when a single measurement is composed of multiple sub-measurements the overall error estimate is the sum-in-quadrature of the component error contributions • when multiple measurements of the same measurand are available they are fused by averaging with each weighted by the reciprocal of the square of its own error estimate
measurements & distributions assignment • (23) You make five range measurements using an ultrasonic sensor; the sensor’s digital display reports ranges {9.9, 10.1, 10.0, 9.9, 10.1} m. The sensor was calibrated at 20 C. The speed-of-sound scales with the square-root of the absolute temperature. Using digital thermometer, you make three measurements: {25.0, 24.9, 25.1} C. Using a mercury-in-glass thermometer you make five measurements: {23.0, 23.5, 26.0, 24.0, 23.5} C. What is your best estimate of the range and its error. (Use one standard deviation for all your error estimates.)
measurements & distributions • some people sometimes use different weights, e.g., a, 1 < < 2, e.g., because they feel it is conservative to give more weight to the less-good data, but = 2 is usually strictly correct • here is a “seat of the pants” derivation, if you are willing to accept some assumptions on faith: • the output measurement is a linear combination of the input measurements. Consider the case of just two:m = a m1 + (1-a) m2, • our aim is to determine optimal weights a, and (1-a) • the output error depends on the same weights applied to the component standard deviations (not their squares):2 = (a 1)2 + ((1-a) )2
measurements & distributions • take the correct value for a to be the onethat minimizes : • d/da == 0 givesa = 22/(12+22)(1-a) = 12/(12+22)from which:m = (m1/12 + m2/22)/(1/12 + 1/22) = (1/12+1/22)-1/2 • extend to more than two measurements by applying this result recursively
measurements & distributions next few topics coming up ... • data acquisition • light sensors
basic sensor fusion updates • what if you already have an observation of a quantity's mean <x> and standard deviation … • … and you make a new measurement x' with standard deviation ' … • … and you want to update <x> and with your new knowledge of x' and '? • it is the same as the problem we just did:<x'> = (<x>/2 + x'/'2)/(1/2 + 1/'2)new = (1/2 + 1/'2)-1/2
basic sensor fusion pop quiz • what do you call an algorithm that implements the above idea, i.e., that the best way to update prior information with new information is to weight each by the square of its standard deviation? • (just kidding about the quiz :-) )