Download
1 / 15
150 likes | 229 Vues
How to Use the Water Quality Results Viewer Application. Kentucky Division of Mine Permits Watershed Characterization Data. After downloading the Watershed Characterization .ZIP file from the DMP Website….

E N D
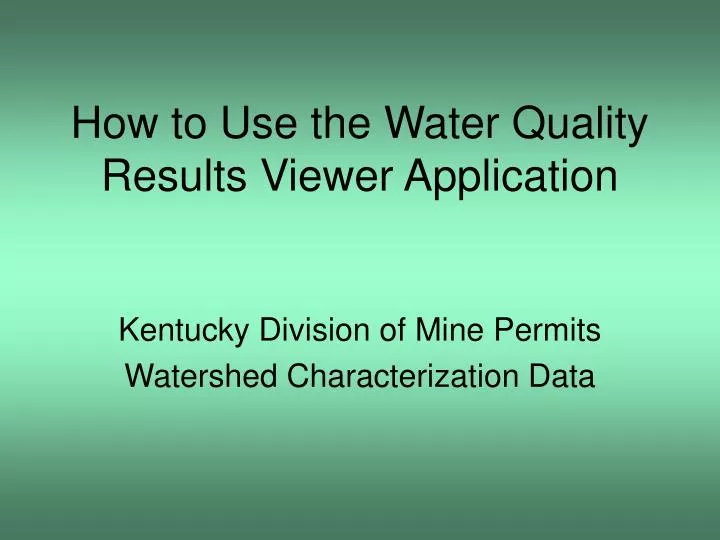
How to Use the Water Quality Results Viewer Application Kentucky Division of Mine Permits Watershed Characterization Data
After downloading the Watershed Characterization .ZIP file from the DMP Website… • Unzip the compressed ZIP file using the compression software application of your choice. This is usually done by just double clicking on the .ZIP file and following the prompts. • Locate the water quality results viewer Microsoft Access application – Ex. BCF_WQ_Results.MDB (the first three letters will be different depending on which watershed package you downloaded). • Make sure that you have Microsoft Access 2003 or higher installed on your computer. • Double click on the water quality viewer .MDB file to start it.
You should see this form appear. It will be empty of data because there are up to four different tables of results data you can select from for most watersheds (some have fewer tables)
Select your data table here This area shows statistics and status of your data records This section has buttons that control the list of data that you see. Remove 0 and negative values, restore records that you removed using a double click, make a graph or export the records to Excel. Also, reset the list to include all records. This is the list area where your data records are displayed. This area lets you filter out records you don’t want see, either by analyte, station or date range. This area lets you sort the list in ten different ways.
This is the form after the SMIS Surface Water results has been selected. All results data is specific to this watershed only. Notice the presence of negative values for Acid. This data is probably not correct and should be removed. You can do this with the touch of a button.
If you just want to see records for dissolved iron and dissolved manganese, just click on them to highlight and click the “GO” button next to the Analyte list. Use the same procedure for particular station IDs and dates. You can combine them anyway you need to. Remember to see all the records again in the list just click here. If you highlight something by accident, click this button to clear the selection.
You can remove individual records or groups of records by highlighting (selecting) them and double clicking. These records are never deleted, just filtered out. And even if you close the form and look at it later, the data will appear exactly as you left it with any filters or sorts you might have applied to it.
Here is the data with those highlighted 0.02 values removed.
To restore those 0.02 values you removed by double clicking, just click on the undo button. This will restore the last set of records you removed.
Click this button to make a graph automatically. Just make sure that your units are the same for all your current records in the list.
Click this button to export whatever records are in the viewer’s list to an Excel spreadsheet.
This area reports minimum and maximum ranges of the current list, the average, also the total count of current records and the number of sampling stations. This button will filter out result values of “0” so that you don’t have to use them in graphs, etc.
You can filter the contents of the list by clicking on one or more analytes, stations, and/or date ranges and clicking the “GO” button. You can sort the list 10 different ways by clicking these buttons Watch the filter on/off (green/red) button to see if you are looking at all of the data available or have filtered some of it out. Remember that the filters you set remain set even if you close the application.
The best way to get familiar with the Results Viewer is just to jump in and start pushing buttons. You can’t break anything, so have fun with it. Some important things to remember - • You can always restore all of the records by clicking the Restore to All Records button • The green/red filter status light on the left will tell you if you are looking at all the data, or just a subset of it • Any filters/sorts that you have set remain in effect until you click the restore button, even if you close the application. • When using graphs, you are able to modify/change the look of the graph by right clicking on certain parts of the graph itself. You can graph up to four analytes but they must all have the same units. • If you need help using the viewer, call (502) 564-2320 and ask for Jeffrey Laird