Download
1 / 47
480 likes | 661 Vues
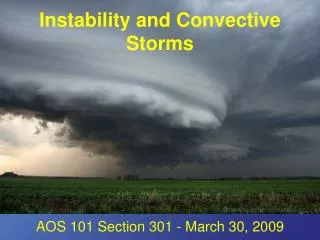
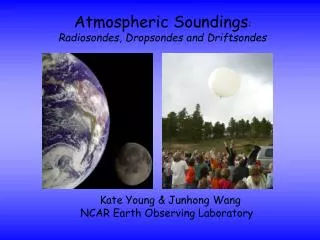
THERMODYNAMICS, SOUNDINGS AND CONVECTIVE PARAMETERS. MSC 243 Lecture #9 29 October 2009. What is a sounding ?. Weather balloon (“radio sonde ”) rises and measures conditions of the atmosphere at different altitudes. Why do we need soundings ?.

E N D
THERMODYNAMICS,SOUNDINGSANDCONVECTIVE PARAMETERS MSC 243 Lecture #9 29 October 2009
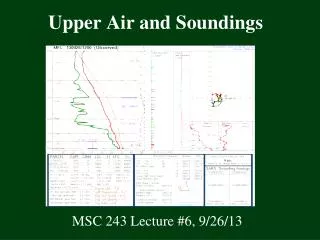
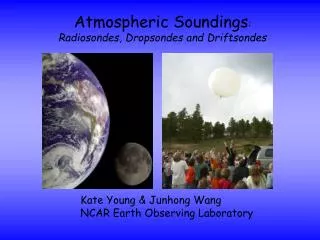
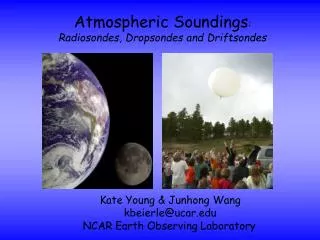
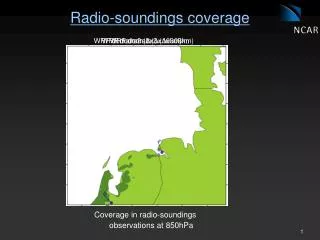
What is a sounding ? Weather balloon (“radio sonde”) rises and measures conditions of the atmosphere at different altitudes
Why do we need soundings ? We don’t know a lot about the atmosphere above the ground but we need to know the state of the atmosphere at many levels to make a forecast! Soundings provide meteorologists and the models with information about what’s going on.
Isobars, Isotherms, Dry Adiabats Skew-T chart is a graphical display of an upper air sounding for a particular ground station. Isobars - straight horizontal solid lines at pressure levels → height information. Isotherms - straight diagonal solid lines sloping from lower left to upper right. These lines are labeled in °C The concept of Skew-T means that the temperature is not plotted vertically but angles off to the right at a 45° angle. Dry adiabats - slightly curved solid lines of constant potential temperature, sloping from the lower right to upper left.
Isobars, Isotherms, Dry Adiabats, Inversions Isobars are lines of constant pressure. Isotherms are lines of constant temperature. Dry adiabats are lines of constant potential temperature. Inversion: Where temperature increases with height ISOBAR ISOTHERM DRY-ADIABAT Inversion
Temperature Temperature Temperature at a specified pressure. At pressure find T curve Read value of isotherm Label in °C Potential Temperature Temperature a parcel of air would have it brought adiabatically to the reference pressure At pressure find T curve Follow dry-adiabat down to 1000mb Read value of isotherm Dew Point Temperature Temperature at which a parcel of air will become saturated if it is cooled. At pressure find Td curve Read value of isotherm Label in °C
Moisture Mixing Ratio “w” The ratio of the mass of water vapor (in grams) to the mass of dry air (in kilograms). At pressure find Td Read value of mixing ratio line Label in g/kg Saturation Mixing Ratio “ws” The water vapor content of the air if it were saturated. At pressure find T Read value of mixing ratio line Label in g/kg
Temperature and Moisture here: at 700 mb • Data from a Skew-T available at each level are: • Temperature • Potential Temperature • Dew Point • Mixing Ratio • Saturation Mixing Ratio Clouds are more likely to occur when T and Td are similar
Moist Adiabats, Mixing Ratio Moist adiabats - slightly curved dashed lines sloping from the lower right to upper left. These lines represent paths that saturated air follows and represents the rate of temperature change in a parcel of saturated air rising pseudo-adiabatically. Pseudo-adiabatically means that all the condensed water vapor is assumed to fall out immediately as the parcel rises. Mixing-ratio lines - slightly curved dashed lines sloping from the lower left to upper right. These lines are labeled in grams per kilogram; grams of water vapor per 1000 grams of dry air.
Moist Adiabats, Mixing Ratio Moist adiabats are lines of constant equivalent potential temperature. (Sometimes known as saturation adiabats) Mixing-ratio lines are lines of constant water content. MIXING-RATIO MOIST-ADIABAT
Relative Humidity Relative Humidity The ratio (in %) of the amount of water vapor in a given volume to the amount that the volume would hold if saturated. At pressure find Td (w) Note value of mixing ratio line At pressure find T (ws) Note value of saturation mixing ratio line RH = w/ws x 100
Inversions Portion of a sounding where the atmospheric temperature or increasing with height. Types of inversions: Radiation Inversion A thermally produced surface based inversion formed by the rapid cooling of air in contact with the surface as compared to the upper layers. Favorable conditions include: Long nights or periods of low solar radiation. Clear skies. Dry air, as moist air absorbs infrared energy. Little winds.
Inversions Subsidence Inversion A mechanically produced inversion formed by adiabatic warming of a layer of sinking air. Favorable conditions include: Strong anticyclones or stable air masses that force air to sink. Frontal Inversion The transition layer between a cold air mass and the warmer air mass above it. Favorable conditions include: Warm air overriding cold air.
Where is the inversion? Rising parcels that encounter an inversion are cooler than their environment, and stop rising.
Key Concepts: Buoyancy Buoyancy: upward force that acts on a parcel of air due to density difference Higher potential temperature and water vapor content increase buoyancy. Precipitation acts to decrease buoyancy. Main thing to look at: is the temperature of the air parcel warmer or cooler than the environment (i.e. the sounding temperature)?
Parcel Motion • As a parcel moves up and down, so long as it is not saturated, its temperature will change at the dry adiabatic lapse rate. • As a parcel moves up and down, so long as it is not saturated, it will conserve its ‘mixing ratio’, the ratio of water molecules to air molecules.
Parcel Motion • If a parcel becomes saturated, continued cooling will result in condensation into water vapor. • The latent heat released by condensation offsets the cooling from expansion, and the parcel will rise at the moist adiabatic lapse rate. • This moist adiabatic lapse rate is generally around 5-6 C / km, not as high as the dry adiabatic lapse rate.
Cloud Formation • First, consider an air parcel at the surface. • When it is warmed at the surface, it is buoyant: it rises and its temperature falls. • If no heat is added or released, the parcel rises “dry adiabatically”. • Adiabatic cooling of rising air is the dominant cause of cloud formation… [On a Skew-T diagram, move up along the dry adiabat from the surface]
Cloud formation • The rising unsaturated air parcel reaches the lifting condensation level (LCL), where it begins to condense. • At the LCL, the air parcel becomes saturated as its temperature reaches the dew point (of the parcel). This is where the cloud base exists. • LCL = the height at which a parcel of air would become saturated if lifted dry adiabatically (point at which saturation would occur if parcel is lifted mechanically: orographic, frontal, etc.)
Lifting Condensation Level (LCL) LCL (~ 860 mb) • At surface pressure find T • Draw a line up parallel to dry adiabat • At surface pressure find Td • Draw a line up parallel to mixing ratio line • The intersection of the 2 lines is the LCL • Read pressure and label in mb
Above the LCL: Cloud Formation • Now that the air parcel is saturated at the LCL, it might be able to rise even higher under the right conditions • Condensation is a warming process: latent heat release may assist further rising. • But, this is partially offset by the cooling due to expansion. • As the parcel rises above the LCL, it cools at a slower rate: the moist adiabatic lapse rate.
Above the LCL: Cloud Formation • Under favorable instability conditions, the air may rise to a level where it becomes warmer than its environment. • This is the Level of Free Convection (LFC) The level beyond (above) which the air parcel becomes buoyant. An air parcel above this level can rise upward even in the absence of any forced lifting • ON A SKEW-T: Start at Lifting Condensation Level (LCL) and follow up the moist adiabat until you reach the temperature line from the sounding
Atmospheric Convection • As an air parcel moves up from the LFC, its temperature is higher than that of the environment, and it is positively buoyant. • Q: What is the air parcel going to do? • A: It will rise further, with no extra help! • The air parcel will continue to cool at the moist adiabatic lapse rate.
Atmospheric Convection • The air parcel remains just saturated. • Hence, as it continues to rise, it condenses more water and forms more clouds and precipitation. • Therefore, convection is associated with clouds and rainfall. • The larger the difference in temperature between the parcel and environment, the faster the updraft, the faster the condensation, and the more severe storms!
Atmospheric Convection • This condensation continues until the air parcel finally reaches the Equilibrium Level (EL). • EL = The height at which the temperature of the buoyant parcel again becomes equal to the environmental temperature. • The EL is where the cloud anvil forms. Sometimes, air parcels with upward momentum may push up through the EL, but then they are heavier than their surroundings and sink back. • ON A SKEW-T: From the point where the LFC was found, follow a moist adiabat up until crossing the temperature line again. • That level is the equilibrium level, at which a parcel of air no longer accelerates upward.
Levels: LCL < LFC < EL EL LFC LCL
Aside: LCL = LFC ? • In some situations, the LCL and LFC can be at the same level!
Stability Indices • Several measures have been devised to quantify how likely it is that a parcel will be able to rise if forced, and how high the parcel will rise. • Most of these indices are related to the concept of stability and lapse rates.
CAPE. • CAPE represents the amount of buoyant energy available to accelerate a parcel vertically, or the amount of work a parcel does on the environment. CAPE is the positive area on a sounding between the parcel's assumed ascent along a moist adiabat and the environmental temperature curve from the level of free convection (LFC) to the equilibrium level (EL). ELCAPE = g ∫[(Tparcel - Tenvir) / Tenvir] dz(in J/kg) LFC - CAPE = 0: Stable. - CAPE < 1000: Marginally unstable. - CAPE = 1000 to 2500: Moderately unstable. - CAPE = 2500 to 3500: Very unstable. - CAPE above 3500: Extremely unstable.
CIN: “Negative Cape” To overcome CIN (Convective Inhibition), some external work is needed to lift the parcel to overcome the tendency to sink. 1. Heating. 2. Moistening. 3. Forced Lifting
Lifted Index • The LI is a commonly utilized measure of stability which measures the difference between a lifted parcel's temperature at 500 mb and the environmental temperature at 500 mb. • LI = T(500 mb envir) - T(500 mb parcel)in degrees C, where T (500 mb envir) represents the 500 mb environmental temperature and T (500 mb parcel) is the rising air parcel's 500 mb temperature. • LI > 0: Stable but weak convection possible for LI = 1-3 if strong lifting is present. • LI = 0 to -3: Marginally unstable. • LI = -3 to -6: Moderately unstable. • LI = -6 to -9: Very unstable. • LI below -9: Extremely unstable.
Lifted Index (KMPX) Convective Parameters often accompany sounding plots This sounding indicates deep convection is quite likely EQ LEV LI LFC
K - Index • The K index is a measure of thunderstorm potential based on the vertical temperature lapse rate, and the amount and vertical extent of low-level moisture in the atmosphere. • K = T(850 mb) + Td(850 mb) - T(500 mb) - DD(700 mb)in degrees C, where T represents temperature, Td represents dewpoint temperature, and DD represents dewpoint depression (the difference between the dewpoint temperature and the actual temperature) at the indicated level. • From SPC: Values greater than 30-40 tend to be associated with deep convection, while thunderstorms are much less common with lesser values.
Lapse Rates and Stability Moist adiabatic lapse rate < dry adiabatic lapse rate
Absolute Stability If the environmental lapse rate < moist adiabatic lapse rate, an air parcel cools more quickly than the environment as it is lifted upward. The air parcel is denser than the environment and we have absolute stability. The air parcel will sink back to its original height.
Absolute Instability If environmental lapse rate > dry adiabatic lapse rate, the environment is absolutely unstable.
Conditional Instability If the moist adiabatic lapse rate < environmental lapse rate < dry adiabatic lapse rate, we have conditional instability. An air parcel at the environmental temperature is (a) unstable to upward displacements if it is saturated, but (b) stable to upward displacements if it is unsaturated. This is the most common situation.
Summary of Skew-Ts • Why do we need Skew-T Log-P diagrams? • Can assess stability of atmosphere • Can see weather elements at every layer • Determine clouds, capping inversions • Determine character of severe weather • Data is assimilated into weather forecast models (GFS etc) • What are the disadvantages? • Only available twice per day (00 and 12 UTC) • Weather can change dramatically between soundings • Wind blows balloon downstream, not instantaneous measurements.
Websites Sounding Archive: Make your own Skew-T’s! http://vortex.plymouth.edu/uacalplt-u.html Useful Sounding Help: http://www.spc.ncep.noaa.gov/exper/soundings/help/index.html Recent Soundings (a week): http://www.spc.ncep.noaa.gov/exper/soundings/ Helpful tutorial on buoyancy and CAPE: http://meted.ucar.edu/mesoprim/cape/cape.htm