Download
1 / 23
350 likes | 1.03k Vues
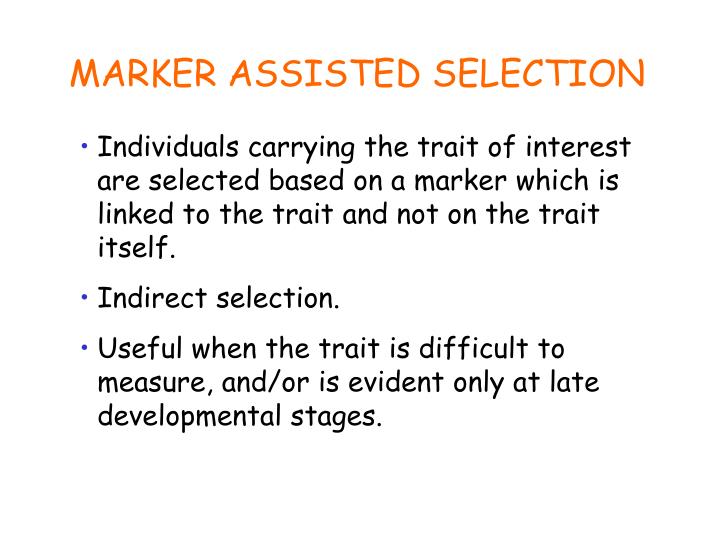
MARKER ASSISTED SELECTION. Individuals carrying the trait of interest are selected based on a marker which is linked to the trait and not on the trait itself. Indirect selection. Useful when the trait is difficult to measure, and/or is evident only at late developmental stages. Winter.

E N D
MARKER ASSISTED SELECTION • Individuals carrying the trait of interest are selected based on a marker which is linked to the trait and not on the trait itself. • Indirect selection. • Useful when the trait is difficult to measure, and/or is evident only at late developmental stages.
Winter Facult. Spring Harrington Kompolti Triumph 88Ab536 Tremois Dicktoo Strider OSU11 Morex Nure Igri ZCCT-H HvSnf2
BARLEY STRIPE RUST www.barleyworld.org
BARLEY STRIPE RUST • Caused by fungus Puccinia striiformis f. sp. hordei • Common in Mexico and South America but usually not in Oregon. • It first appeared in the US in 1991 • When infection is severe, losses of 50% are common
BARLEY STRIPE RUST • Resistant cultivars are available • It is necessary to develop resistant cultivars adapted to different barley growing areas • Resistance to the disease is a quantitative trait (non-Mendelian inheritance) • Three Quantitative Trait Loci (QTL) for stripe rust resistance have been mapped and their effects validated. • There are molecular markers located in the target regions of the three QTL
Cali-sib x Bowman Shyri x Galena CI10587 x Galena BSR-45 D1-72 D3-6 Harrington Baronesse Orca BCD DB BCD47 BCD12 D3-6/B23 D3-6/B61 AJO BU OPS
ORO OWB Chr. 4H EBmac701 SSR markers used for MAS baal29j18 *
Flanking markers in each target region Three resistance genes in chromosome 1H, 4H and 5H
THE PROBLEM • KURTFORD • 6 –rowed hooded feed barley • Well adapted to California conditions • Short height • Stripe Rust Susceptible
iBISON 1H+4H+5H • Resistance alleles for the three genes • 2–rowed awned barley; short height
SOLUTION: The Kurtford Conversion Year 1 I Bison 1H 4H 5H Kurtford 1H 4H 5H X SS SS SS RR RR RR Kurtford 1H 4H 5H F1 heterozygote at 3 BSR resistance loci X RS RS RS SS SS SS BC1F1 12.5% of plants expected to be heterozygote at 3 BSR resistance loci. Segregation in each locus: ½ RS ½ SS
Summer – Fall 2007 • We have 589 BC1F1 seeds and we expect to find around 74 target heterozygotes at the 3 BSR resistance loci.We need: • -Confirm choice of markers • DNA extraction for 589 plants • Genotyping for the 3 BSR resistance regions • Selection of targeted genotypes MAS1 1H 4H 5H Bmag399 EST4473 EST4535 Baal29j18 . Bags 4e Bmag337 Bmag223 Bmag812
I I I K I K I I K iBison 1H+4H+5H Kurtford
Winter 2008 • Selection of heterozygotes (~74) • 10 seeds per selected plant ~ 740 BC1F2 plants. • Grow out and genotype BC1F2 plants segregating in each locus: ¼ RR ½ RS ¼ SS MAS2 We expect 25% of the BC1F2 to be homozygous for AT LEAST the 4H region (~ 185). Of these: ~ 104 homozygote only for 4H ~ 35 homozygote for 4H and 1H ~ 35 homozygote for 4H and 5H ~ 11 homozygote for 1H, 4H and 5H 25/64 (~ 38%) of the resistant plants will be homozygous hooded
Winter 2008/2009 – seed increase Summer 2009 – validate resistance Field test ~ 70 homozygous hooded, BSR resistant plants
Genomic Selection Methodology • A Training Population is genotyped with a large number of markers and phenotyped for important traits • Genome-wide markers are considered to be random effects and all marker effects on the phenotype are estimated simultaneously in a single model • One or more markers are assumed to be in LD with each QTL affecting trait • Prediction model attempts to captures the total additive genetic variance to estimate breeding value of individuals based on sum of all marker effects In a Breeding Population individuals are genotyped but not phenotyped • A genomic estimated breeding value (GEBV) for each individual is obtained by summing the marker effects for that genotype • Prediction model can be used to impose multiple generations of selection
GENOMIC SELECTION Genotyping Training population (Breeding lines) Phenotyping Development of Prediction Model / Cross-Validation Application of prediction model Genotyping Genomic estimation of breeding values (GEBV) Intermate and next cycle of GS Selection
BLUPs for each marker Genomic Estimated Breeding Value (GEBV):
True Value True Value GEBV GEBV • 3,000 SNPs • Ridge Regression • Results of Cross Validation