Download
1 / 40
661 likes | 1.41k Vues
Introduction to GIS. Laurie Garo Geog. 2103: Introduction to GIScience & Technologies Fall, 2012. Outline. What is GIS? Elements or Components of GIS Data Layers as GIS Fundamentals How does a GIS Work? Uses/Applications of GIS. What is GIS?.

E N D
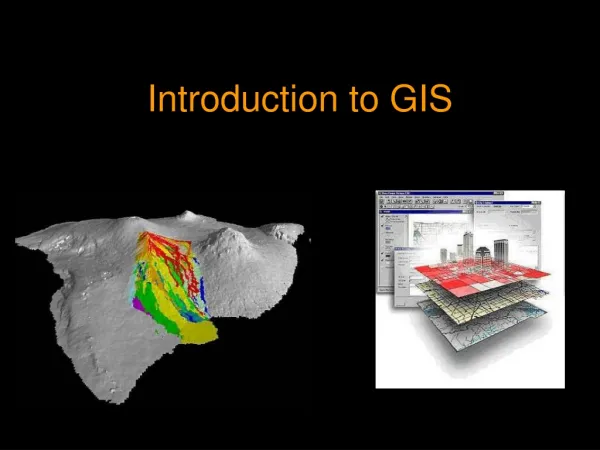
Introduction to GIS Laurie Garo Geog. 2103: Introduction to GIScience & Technologies Fall, 2012
Outline • What is GIS? • Elements or Components of GIS • Data Layers as GIS Fundamentals • How does a GIS Work? • Uses/Applications of GIS
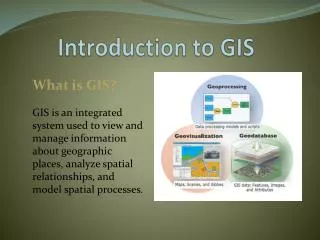
What is GIS? • A Geographic Information System is an organized collection of computer hardware, software, geographic data, and personnel designed to efficiently capture, store, update, manipulate, analyze, and display all forms of geographically referenced information. (ESRI,1990)
Elements or Components of GIS • Computer System: • Hardware • Software • Spatial Data • Data Management, Analysis, & Presentation Procedures (software-related) • Personnel
Computer System Hardware: • Powerful Processor to run complex software • Sufficient memory (RAM) and space for storage and processing of large volumes of data • Good quality, high resolution color graphics screen • Data Input and Output Devices: Digitizer, scanner, keyboard, printers, plotters
Computer System Software: • Enables input and management of spatial and attribute data; • Relational Data Base links spatial and attribute data; • Enables queries of spatial and attribute data and creation of new data sets from query results; • Provides various functions to select, calculate, classify, combine, and extract from data sets; • Enables the preparation of maps, charts, tables and text to present results.
Spatial Data • Any feature or phenomena with spatial (coordinate) location; • Formats: • Vector: Points, Lines, Polygons (Areas) • Raster: Grid Cells; 3_D Surfaces • Separated into spatial data layers by feature and format type; • Requires descriptive data (attributes)
GIS Data Layers By Feature and Format Type With Attribute Data
Crime Streets Structures Land Use How information is stored in a GIS • Information about your community is entered into a GIS as “layers”
Crime type: Robbery Address: 901 E 2nd St Date: May 22, 1998 Time: 2200 Main St Location Attribute How GIS works The mapped data can be searched / queried to find out information about the points on the map.
Crime Type Address Date Time 101 E 2nd Robbery May 22, 2200 St 1997 830 Main Robbery May 15, 2030 St 1997 Main St 100 Cross May 29, 1500 Robbery St 1997 1000 Robbery June13, 1997 2245 Main St 997 June 3, 2300 Auto Theft Main St 1997 Attribute Location How GIS works The database can be queried to find out where crimes occurred on the map.
Street name: Main St Address range: 800-899 Number lanes: 4 Type: 2-way Location Attribute How GIS works Linear features can also be selected on a map to obtain information.
Address Range Number Lanes Street Name Type Main St 800-899 4 Two way Two way Main St 900-999 4 4 700-799 Two way Main St Chester Rd 100-199 2 One way 2 1st St 300-399 Two way Attribute Location How GIS works Like point data, linear features can be selected from the table to find out where they are located on the map.
Patrol Area: 1 Population: 5,200 Housing Units: 1750 Neighborhoods: 35 Location Attribute How GIS works Areas can also be selected on a map to obtain information.
Attribute Location How GIS works Housing Units Neighbor- hoods Patrol Area Pop. 1,750 35 5,200 1 70 2 10,000 3,375 30 1,450 3 4,300 Just as with the point and linear features, a record describing an area can be selected from the table and then located on the map.
Points, Lines and Areas/Polygons • Point • Street Light • Bus Stop • Line • Street • River • Area/Polygon • Neighborhood • Police Beat Point Line Area
GIS Overlay: Points and Areas Point C Point A Point B Point C Pink Point A Blue Point B Orange Input Point Theme: Polygon Theme: Output Point Theme: By combining data sets
GIS Overlay: Lines and Areas • Each line receives a data item that contains the polygon in which it falls • Example would be selecting all the streets within a particular neighborhood(s) or by a particular land use
GIS Overlay: Areas and Areas • Using a polygon to select another polygon(s) • Identify overlapping areas • Example would be selecting all the buildings within a flood zone
Robbery Auto Theft 13:00-18:00 18:00-23:00 May June Grouping/Categorizing Data Main St Main St Main St The data could be mapped by type of crime, date, time or MO.
Layer Theme Coverage How information is stored in a GIS • Layers are usually added into a GIS project file • Unlike typical files such as spreadsheets or word processing documents, the actual data for each layer is not stored within the project file • The project file only contains pointers to the data GIS Project
Getting Data Into GIS - Geocoding • Address Matching • Primary method used by police departments to map incident data • Global Positioning Systems (GPS) • Automatic Vehicle Location (AVL) • Specialized Uses • ATM locations • Street lights • Mile markers
Getting Data Into GIS • Address Matching • the process of determining the physical location of addresses according to a standard reference file such as a street centerline file or a parcel coverage • data files • best if address components are stored in separate fields • Names, abbreviations, numbering should remain consistent for ALL entered addresses Address NumberPrefixNameSuffixExtension 3763 North Main St 22222 East St 646 West Av 11136 15th Rd West
Address matching to a Street Centerline File Street File - Attributes LeftRange RightRangeStreet-Name 100-198 101-199 Main St 200-298 201-299 Main St 300-398 301-399 Main St 100-198 101-199 South Blvd 200-298 201-299 South Blvd 300-398 301-399 South Blvd 400-498 401-499 East Rd 500-598 501-599 East Rd 400-498 401-499 West Rd 500-598 501-599 West Rd 500-599 500-599 East Rd West Rd Main St 300-399 200-299 100-199 400-499 400-499 South Blvd Address to match: 160 Main St 100-199 200-299 300-399 Street Centerline
Purpose for Using GIS Strategic / Research • Analyzing crime clusters / hotspots over time • Growth patterns and crime Tactical • Pattern identification (e.g. M / O, along thoroughfares, etc) • Analyzing individual crime clusters / hotspots • Suspect identification Administrative • Accountability / Evaluations • Personnel allocation • Changing laws / ordinances • Community Meetings
Uses of GIS Resource Management: GIS can enhance an agency or individual unit’s productivity and efficiency. It can help determine where and how to strategically deploy personnel and their activities. Examples: • Deploying additional resources in chronic hotspot areas • Redistrict using GIS to balance workload among police beats and maintain neighborhood boundaries and linkages
Uses of GIS Hypothesis generation / Evaluation of alternatives: GIS can help determine the relationship between data sets. It can be used to quantify the impact of events / circumstances and evaluate possible responses to problems. Examples: • The potential impact of a community convenience store on crime in the neighboring area • The addition of a gated community versus an easily accessed community in your jurisdiction • Land ownership and crime patterns
Uses of GIS Data management / integration: Data from multiple sources / departments can be integrated and analyzed through GIS. Examples: • Unserved warrants • Vice and narcotics • Tax data - land use, owner information • Public housing / Section 8 housing • School zones • Concentrations of ethnic groups • Zoning • Building permits
Uses of GIS Gain support for programs: A visual map / display can quickly be analyzed and interpreted by persons not familiar with a specific situation. Law enforcement efforts can be summarized and “sold” to potential partners. (Note: validity and accuracy of data is essential.) Examples: • Map crime and apartment complexes to gain support for a resident screening program • Map crime and owner / renter properties to gain support for home ownership programs
Uses of GIS Demonstrate needs: What better way to demonstrate to supervisors or elected officials that there is a need than through a map. “A picture is worth a thousand words.” Examples: • Map juvenile crime and victimization patterns to assess the need to implement a local curfew ordinance • Map alcohol outlets and crime to demonstrate the potential need for cracking down on liquor law violations • Map drug-related robberies and auto thefts to justify the formation of a street drug interdiction unit
Uses of GIS Monitoring: GIS can be used to monitor crime patterns over time to show how crime has changed (time-series analysis) and determine whether community needs are being met. Examples: • Track shifts in crime hotspots and repeat crime locations within a problem community • Map areas within your jurisdiction experiencing significant crime increases / decreases to track progress of crime prevention / problem solving activities • Track drug activities occurring within 500 feet of schools • Monitor police activities in relation to citizen complaints
Uses of GIS Evaluate / Demonstrate accomplishments: This use of GIS is similar to demonstrating needs mentioned earlier because of its ability to summarize data. GIS facilitates the evaluation process. Examples: • Map residential properties turned over to a responsible owner and show how crime has decreased in the area over time • Map police calls for service at and around a commercial strip to demonstrate how new management practices have decreased crime and disorder at the businesses and surrounding area
Web GIS: a few local examples • http://polaris.mecklenburgcountync.gov/website/redesign/viewer.htm • http://meckcama.co.mecklenburg.nc.us/relookup/
Sources: • ESRI, 1990: Understanding GIS • Carolinas Institute for Community Policing ( CICP) • Data Management, Analysis, & Presentation Procedures (software-related): • Next slide series: GIS Project Overview