Download
1 / 4
40 likes | 123 Vues
AR1 BPM Calibration (for new electronics). Before any TOA measurements we attempted to look at the BPM calibration (AR2-BPM-03) Turn off quads (Q1,Q2) and sextupole and vertical corrector in first half of AR1. The beam doesn’t seem to blow up.

E N D
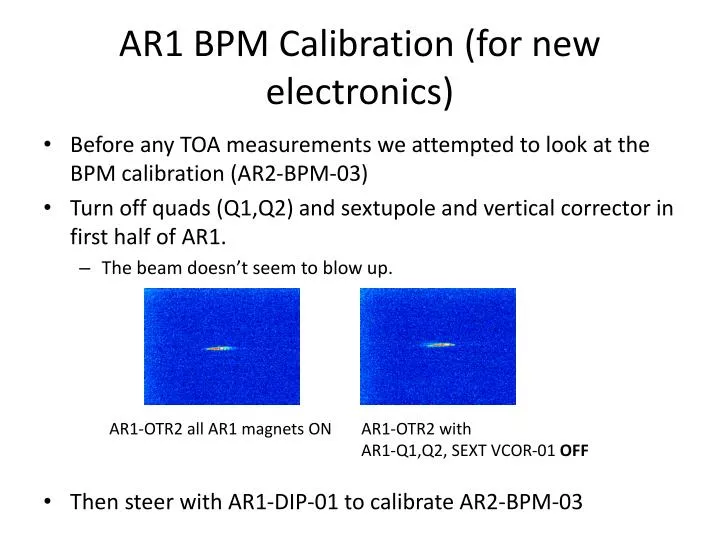
AR1 BPM Calibration (for new electronics) • Before any TOA measurements we attempted to look at the BPM calibration (AR2-BPM-03) • Turn off quads (Q1,Q2) and sextupole and vertical corrector in first half of AR1. • The beam doesn’t seem to blow up. • Then steer with AR1-DIP-01 to calibrate AR2-BPM-03 AR1-OTR2 all AR1 magnets ON AR1-OTR2 with AR1-Q1,Q2, SEXT VCOR-01 OFF
AR1 BPM Calibration • Change in AR1-DIP-01 current predicts poistion change at AR1-BPM-03 • L_dipole = 510 mm, = 60°, 0= L_dipole/60° = 490 mm, z (distance AR1-DIP-01 exit to AR1-BPM-02) = 2.300 m • Thus [x/I/I0]predicted = 2.24 m
AR1 BPM Calibration • A nominal calibration is entered 20mm *(((A-P1)+(D-P2))-((B-P2)+(C-P1)))/ ((A-P1)+(B-P2)+(C-P1)+(D-P2))20 • Bunch position varies over train (used 5 μsec train arbitrarily) • Can look at BPM calibration for each bunch first bunch last bunch Distribution of calibrations for all the bunches. Varies by about 8%. Expected value is -2240 (20% different to measured)
Additional Info • If we plot the calibration factor vs bunch number, rather than just a histogram of calibration values, we see a clear correlation. • So this suggests the spread in calibrations is not statistical but systematic. • Perhaps the best calibration value to take is around bunch # 70-80 where the bunch position begins to plateau • These bunches also give the best symmetrical range of x positions around x = 0. For the first dipole setting, x ~ - 7 ; for the last dipole setting, x ~ + 9 • So if we take -1950 to be the measured calibration factor, and the real calibration should be -2240, then the calibration factor in the software should be changed from 20 mm to 23 mm.