Download
1 / 72
720 likes | 957 Vues
Introduction to the 7000 Hearing Aid Test System. By: Kristina FryeFrye Electronics, Inc.. . Outline of this Presentation. Real-ear MeasurementsEntering an AudiogramReal-ear SPL measurementsVisible SpeechInsertion GainCoupler MeasurementsANSICoupler MulticurveAdvanced Coupler: Enhanced DSP,

E N D
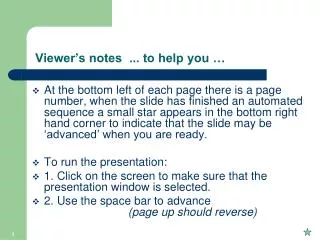
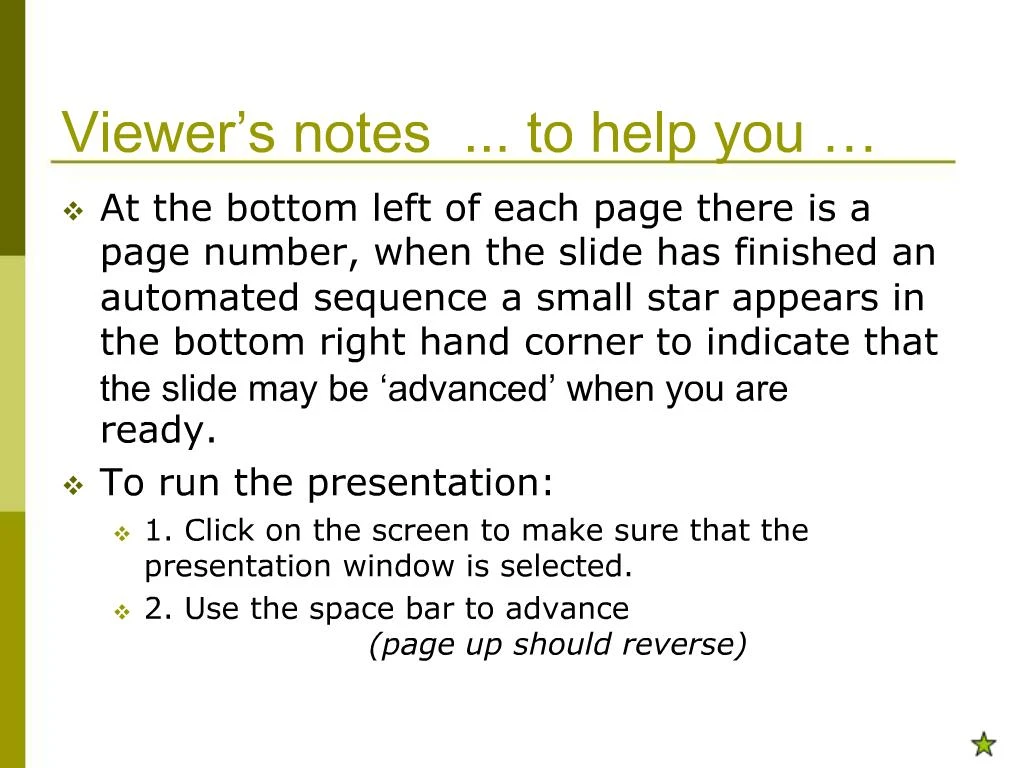
1. Viewer�s notes ... to help you � At the bottom left of each page there is a page number, when the slide has finished an automated sequence a small star appears in the bottom right hand corner to indicate that the slide may be �advanced� when you are ready.
To run the presentation:
1. Click on the screen to make sure that the presentation window is selected.
2. Use the space bar to advance (page up should reverse)
2. Introduction to the 7000 Hearing Aid Test System By: Kristina Frye
Frye Electronics, Inc.
3. Outline of this Presentation Real-ear Measurements
Entering an Audiogram
Real-ear SPL measurements
Visible Speech
Insertion Gain
Coupler Measurements
ANSI
Coupler Multicurve
Advanced Coupler: Enhanced DSP, Attack & Release, I/O, Battery Current
This presentation starts with a description of the Real-ear features on the FONIX 7000 Hearing Aid Test System. REM is only available with the Real-ear Option. The next major topic is Coupler Measurements, provided standard with every 7000.This presentation starts with a description of the Real-ear features on the FONIX 7000 Hearing Aid Test System. REM is only available with the Real-ear Option. The next major topic is Coupler Measurements, provided standard with every 7000.
4. Open Fit Hearing Aids Some Open Fit hearing aids interfere with the reference microphone measurements outside the ear.
Disable the Reference Microphone in the local menu to perform real-ear on these hearing aids.
Noise Reduction on analyzer may interfere with anti-feedback phase shifting technology. Turn OFF noise red (comp)
Real-ear targets may prescribe low frequency amplification unsuitable for open fit hearing aids.
5. Real-Ear Navigation Screen Enter the Real-ear Navigation screen by pressing F2 from the Opening screen. You use this screen to enter any of the five real-ear screens. Press EXIT from this screen to go back to the Opening screen.Enter the Real-ear Navigation screen by pressing F2 from the Opening screen. You use this screen to enter any of the five real-ear screens. Press EXIT from this screen to go back to the Opening screen.
6. Entering an audiogram F1 toggles between left and right ear. F2 toggles between the HTL and UCL selections. When NAL-NL1 is the selected fitting rule, F2 can also be used to select Bone. If bone values are not entered, predicted values are used. F3 is used to predict UCL values that are used in the real-ear SPL screen. The arrow keys are used to actually input the HTL and UCL values (UP/DOWN adjusts frequency. RIGHT/LEFT adjusts amplitude.) Real-ear target settings are located in the local menu. F1 toggles between left and right ear. F2 toggles between the HTL and UCL selections. When NAL-NL1 is the selected fitting rule, F2 can also be used to select Bone. If bone values are not entered, predicted values are used. F3 is used to predict UCL values that are used in the real-ear SPL screen. The arrow keys are used to actually input the HTL and UCL values (UP/DOWN adjusts frequency. RIGHT/LEFT adjusts amplitude.) Real-ear target settings are located in the local menu.
7. Real-ear NOAH Module If you are using the FONIX NOAH Real-ear Module, you can right-click on the audiogram to send it to the analyzer. This is useful for those users who prefer using the front panel interface on the analyzer to perform measurements.If you are using the FONIX NOAH Real-ear Module, you can right-click on the audiogram to send it to the analyzer. This is useful for those users who prefer using the front panel interface on the analyzer to perform measurements.
8. Real-Ear SPL screen Check low inputs are above thresholds
Check average inputs meet target
Check loud inputs are below UCLs
Auto-adjusting REUR shows amplification benefit at all levels
Gives overall look at hearing aid fitting The SPL screen is a different method for performing real-ear measurements. It displays the patient's thresholds, target, and UCL values in dB SPL with the real-ear targets and measurements so you can get a complete look at the hearing aid fitting.The SPL screen is a different method for performing real-ear measurements. It displays the patient's thresholds, target, and UCL values in dB SPL with the real-ear targets and measurements so you can get a complete look at the hearing aid fitting.
9. Real-ear SPL Test Screen This is what the Real-ear SPL test screen looks like before any measurements have been taken.This is what the Real-ear SPL test screen looks like before any measurements have been taken.
10. NAL-NL1 Target Settings
11. Real-ear NOAH Module You can send the target settings to the analyzer from the FONIX NOAH Real-ear Module. This feature is for users who prefer the front panel interface of the analyzer for performing measurements.You can send the target settings to the analyzer from the FONIX NOAH Real-ear Module. This feature is for users who prefer the front panel interface of the analyzer for performing measurements.
12. Step 1: Setup This is the basic real-ear setup. The sound field speaker should be placed about 12 inches from the patient at a 45 degree angle. The reference microphone is placed above the ear and the probe microphone is placed below the ear.This is the basic real-ear setup. The sound field speaker should be placed about 12 inches from the patient at a 45 degree angle. The reference microphone is placed above the ear and the probe microphone is placed below the ear.
13. Step 2: Level Press the LEVEL button to level the sound field. Note: The probe microphone position doesn't matter for leveling; only the reference microphone is used.Press the LEVEL button to level the sound field. Note: The probe microphone position doesn't matter for leveling; only the reference microphone is used.
14. Step 3: Unaided (optional) To measure the unaided response, use F2 to select the curve to measure, use F4 to select the source type, use the arrow keys to set the source level (all of these settings should already be configured with good default settings) and press [START] to start the measurement. Press [STOP] when the measurement has stabilized. This is an optional measurement.To measure the unaided response, use F2 to select the curve to measure, use F4 to select the source type, use the arrow keys to set the source level (all of these settings should already be configured with good default settings) and press [START] to start the measurement. Press [STOP] when the measurement has stabilized. This is an optional measurement.
15. Step 4: Aided @ 50 dB SPL Use F2 to select REAR 2. Use F5 to select the source type. Use the arrow keys to select the input level (default is 50 dB). Press START to start the measurement. Notice that if the REUR Auto Adjust setting is turned on, the unaided curve automatically adjusts to what it would be if it had been measured at the input level of the aided curve (in this case, 50 dB SPL). This is useful for direct comparisons of the aided response to the unaided response.Use F2 to select REAR 2. Use F5 to select the source type. Use the arrow keys to select the input level (default is 50 dB). Press START to start the measurement. Notice that if the REUR Auto Adjust setting is turned on, the unaided curve automatically adjusts to what it would be if it had been measured at the input level of the aided curve (in this case, 50 dB SPL). This is useful for direct comparisons of the aided response to the unaided response.
16. Step 5: Aided @ 65 dB SPL Use the same steps to perform an aided measurement at 65 dB SPL. Compare this measurement to the �M� target.Use the same steps to perform an aided measurement at 65 dB SPL. Compare this measurement to the �M� target.
17. Step 6: REAR @ 80 dB SPL Use F2 to select REAR 4 and measure the response at 80 dB SPL. Compare this measurement to the �H� target.Use F2 to select REAR 4 and measure the response at 80 dB SPL. Compare this measurement to the �H� target.
18. Step 7: REAR @ 90 dB with Burst Use F2 to select REAR 5. Use a pure-tone short sweep to compare this measurement to the patient�s uncomfortable levels. The pure-tone signal is better for this particular purpose because it gives the hearing aid a full 90 dB SPL signal at every frequency.Use F2 to select REAR 5. Use a pure-tone short sweep to compare this measurement to the patient�s uncomfortable levels. The pure-tone signal is better for this particular purpose because it gives the hearing aid a full 90 dB SPL signal at every frequency.
19. NOAH Real-ear Module You can use the FONIX NOAH Real-ear Module to collect data results already measured on the analyzer. Alternately, you can use the Windows interface to perform your measurements from NOAH and compare them to the targets display on the NOAH screen (see next slides).You can use the FONIX NOAH Real-ear Module to collect data results already measured on the analyzer. Alternately, you can use the Windows interface to perform your measurements from NOAH and compare them to the targets display on the NOAH screen (see next slides).
20. Using Real-ear Module Automatically uses latest NOAH audiogram
Send audiogram and target to analyzer to measure with analyzer controls. Use Get Curves to grab tests results
Or perform measurements using Windows controls
21. Audiometric Info tab If you are using the Windows interface in the FONIX NOAH Module to perform the measurements, the Audiometric Information tab is mostly for confirming the NOAH module has imported the latest audiogram for your patient.If you are using the Windows interface in the FONIX NOAH Module to perform the measurements, the Audiometric Information tab is mostly for confirming the NOAH module has imported the latest audiogram for your patient.
22. Target Settings The Target settings is to adjust the setting to match the needs of your patient.The Target settings is to adjust the setting to match the needs of your patient.
23. Test Setup To perform measurements in the Measurements and Targets tab, first select the test type: Real-ear or Coupler, Gain, Insertion Gain, or SPL. Next Level the sound field/sound chamber. Select the curve you want to measure. It will be marked with a checkmark. Press START. There is a target for each aided measurement curve. You can turn off the display of any measurement or target without deleting it by removing the �X� next to each curve.To perform measurements in the Measurements and Targets tab, first select the test type: Real-ear or Coupler, Gain, Insertion Gain, or SPL. Next Level the sound field/sound chamber. Select the curve you want to measure. It will be marked with a checkmark. Press START. There is a target for each aided measurement curve. You can turn off the display of any measurement or target without deleting it by removing the �X� next to each curve.
24. Real-ear SPL in NOAH Real-ear Module This slide describes how to perform Real-ear SPL measurement specifically.This slide describes how to perform Real-ear SPL measurement specifically.
25. Completed Real-ear SPL Test
26. Automatic Testing Click the Settings button from the main test screen to open the Settings window. Select the Test Settings tab. The �Enable Curve Auto Advancement� is used during manual measurements. After a curve has been measured, the next curve is automatically selected. When running fully-automatic measurements (multiple curves in sequence), you can either run all of them together �Run All Curves�, or you can run only the curves that have been selected: �Run Only Selected Curves�.Click the Settings button from the main test screen to open the Settings window. Select the Test Settings tab. The �Enable Curve Auto Advancement� is used during manual measurements. After a curve has been measured, the next curve is automatically selected. When running fully-automatic measurements (multiple curves in sequence), you can either run all of them together �Run All Curves�, or you can run only the curves that have been selected: �Run Only Selected Curves�.
27. Fully Automatic Test To run fully automatic test, select the curves you want to measure by filling in the �X� next to their listing in the curve box. Select �Run Measurements Automatically�. Click Start. All selected curves will be run sequentially.To run fully automatic test, select the curves you want to measure by filling in the �X� next to their listing in the curve box. Select �Run Measurements Automatically�. Click Start. All selected curves will be run sequentially.
28. Visible Speech Use live speech signal
Real-time response (during test)
Average response
Minimum and maximum response per frequency for the length of the test (optional)
HTLs
UCLs
SII
Reference microphone
All on one graph in dB SPL
29. Visible Speech: Before Test The Visible Speech screen on the 7000.The Visible Speech screen on the 7000.
30. Visible Speech: Test Results This is an example of Visible Speech. The maximum, average, and minimum response of the aid to the live speech signal are shown. The HTLs and UCLs are also displayed, although in this case, the UCLs are higher than any test results and not displayed.This is an example of Visible Speech. The maximum, average, and minimum response of the aid to the live speech signal are shown. The HTLs and UCLs are also displayed, although in this case, the UCLs are higher than any test results and not displayed.
31. RMS Info in Visible Speech Max = RMS of the maximum curve
Min = RMS of minimum curve
Avg = RMS of average curve
Ref = RMS of reference microphone (input)
32. Visible Speech without Max/Min
33. Visible Speech in Real-ear NOAH Visible Speech testing can also be performed through the NOAH Real-ear ModuleVisible Speech testing can also be performed through the NOAH Real-ear Module
34. Insertion Gain features Unaided measurement
Up to 4 aided measurements
Gives up to 4 insertion gain measurements
In the Insertion Gain screen, you can take an unaided measurement and up to four aided measurements.In the Insertion Gain screen, you can take an unaided measurement and up to four aided measurements.
35. Insertion Gain screen F1 toggles between ears. F2 selects the curve to be tested. There are five possible curves � Unaided 1 and Aided 2-5. F3 is used to toggle the display of the curves on and off. F4 is used to delete curves. F5 is used to select the source type (Composite, Digital Speech, Pure-tone Normal, Short, Fast). The up and down arrow keys are used to adjust the amplitude of the source signal.F1 toggles between ears. F2 selects the curve to be tested. There are five possible curves � Unaided 1 and Aided 2-5. F3 is used to toggle the display of the curves on and off. F4 is used to delete curves. F5 is used to select the source type (Composite, Digital Speech, Pure-tone Normal, Short, Fast). The up and down arrow keys are used to adjust the amplitude of the source signal.
36. Unaided Measurement Unaided measurements are typically performed at 65 dB SPL with the Composite or Digital Speech signal. Use F2 to select REUR 1. Use F5 to select the input signal type. Use the up and down arrow keys to adjust the amplitude. Press START to begin the measurement and STOP to end it. It's important to insert the probe tube deeply enough so that the peak in the response happens at about 3 kHz and that the response at 6 kHz is not negative. Unaided measurements are typically performed at 65 dB SPL with the Composite or Digital Speech signal. Use F2 to select REUR 1. Use F5 to select the input signal type. Use the up and down arrow keys to adjust the amplitude. Press START to begin the measurement and STOP to end it. It's important to insert the probe tube deeply enough so that the peak in the response happens at about 3 kHz and that the response at 6 kHz is not negative.
37. Aided/IG measurements This is an example of an insertion gain measurement. The top graph shows the IG target and IG curve. The bottom graph shows the unaided and aided responses. When NAL-NL1 is selected, the target automatically adjusts to the current selected source, giving a target that is appropriate for the selected test conditions.This is an example of an insertion gain measurement. The top graph shows the IG target and IG curve. The bottom graph shows the unaided and aided responses. When NAL-NL1 is selected, the target automatically adjusts to the current selected source, giving a target that is appropriate for the selected test conditions.
38. Multiple Aided/IG measures You can make several different measurements at different levels in the Insertion Gain screen in order to check the compression characteristics of the hearing aid.You can make several different measurements at different levels in the Insertion Gain screen in order to check the compression characteristics of the hearing aid.
39. Testing Directionality You can use the insertion gain screen for a quick check of directionality. Perform the "unaided" measurement with the speaker positioned behind the patient. Perform the "aided" measurement with the speaker positioned in front of the patient. The "insertion gain" result is the directional advantage of the hearing aid. You can use the insertion gain screen for a quick check of directionality. Perform the "unaided" measurement with the speaker positioned behind the patient. Perform the "aided" measurement with the speaker positioned in front of the patient. The "insertion gain" result is the directional advantage of the hearing aid.
40. Gain with Real-ear NOAH There are two types of �gain� displays in the FONIX NOAH Real-ear Module: The �Gain� display is the difference between the sound field outside the ear and the measurement by the probe tube inside the ear.There are two types of �gain� displays in the FONIX NOAH Real-ear Module: The �Gain� display is the difference between the sound field outside the ear and the measurement by the probe tube inside the ear.
41. Insertion Gain with NOAH The Insertion Gain is the difference between the aided and the unaided measurement curves.The Insertion Gain is the difference between the aided and the unaided measurement curves.
42. Coupler Measurements ANSI, Coupler Multicurve, Enhanced DSP, Battery, Attack & Release, I/O
43. Basic Coupler Measurements Coupler measurements are usually made in two ways. Most commonly, people use the ANSI test sequence in order to run an array of different measurements and determine whether the hearing aid is meeting the manufacturing specifications according to the ANSI standard. The Coupler Multicurve screen can be used to perform coupler frequency response measurements using different types of source types and amplitudes for more real-world results.
The F4-F7 keys are user assignable, but, by factory default, F4 will take you to the ANSI 03 test screen.Coupler measurements are usually made in two ways. Most commonly, people use the ANSI test sequence in order to run an array of different measurements and determine whether the hearing aid is meeting the manufacturing specifications according to the ANSI standard. The Coupler Multicurve screen can be used to perform coupler frequency response measurements using different types of source types and amplitudes for more real-world results.
The F4-F7 keys are user assignable, but, by factory default, F4 will take you to the ANSI 03 test screen.
44. ANSI 03 Settings Use the function keys to choose most used settings. Press MENU to open the local menu for additional settings. Press START to begin the test sequence.Use the function keys to choose most used settings. Press MENU to open the local menu for additional settings. Press START to begin the test sequence.
45. ANSI 03 Results This an example of ANSI 03 test results.This an example of ANSI 03 test results.
46. Troubleshooter ANSI You can also perform ANSI measurements through the Troubleshooter NOAH module. You can also perform ANSI measurements through the Troubleshooter NOAH module.
47. Coupler Multicurve Features Realistic frequency response measurements
Variety of signal types: Composite, Digital Speech, Pure-tone sweeps
Display 10 different curves simultaneously
Switch back and forth between gain and output. All curves translated.
The Coupler screen is generally used to obtain realistic frequency response measurements. You can use a variety of test signals and make up to 10 different measurements per ear.The Coupler screen is generally used to obtain realistic frequency response measurements. You can use a variety of test signals and make up to 10 different measurements per ear.
48. Coupler Screen Operation The function keys are used to make most selections. You can make 10 frequency response for each ear. F5 is used to select the source type. Choose between Composite, Digital Speech, or three types of pure-tone sweeps. The up-down arrow keys are used to select the curve amplitude.The function keys are used to make most selections. You can make 10 frequency response for each ear. F5 is used to select the source type. Choose between Composite, Digital Speech, or three types of pure-tone sweeps. The up-down arrow keys are used to select the curve amplitude.
49. Example In this example, an aid was tested using the Composite signal at 50, 60, 70, and 80 dB SPL. Notice how as the input level goes up, the gain goes down. This demonstrates the aid is compressing.In this example, an aid was tested using the Composite signal at 50, 60, 70, and 80 dB SPL. Notice how as the input level goes up, the gain goes down. This demonstrates the aid is compressing.
50. Troubleshooter Coupler Multicurve You can also perform multicurve coupler measurements using the NOAH Troubleshooter module.You can also perform multicurve coupler measurements using the NOAH Troubleshooter module.
51. Testing Digital Aids Digital Speech
Type of Composite signal
Modulated to allow testing of noise reducing digital aids
Used with ANSI or ICRA speech spectra
High-end digital hearing aids sometimes have technology designed to reduce noise or enhance speech. Typically, these aids listen for continuous noise in the environment and lower the gain of the aid at the offending frequencies. Unfortunately, the aid also treats standard test signals, such as the Composite or pure-tone sweeps, as noise in its environment. In order to be able to accurate test these aids, we developed a modulated version of the composite signal called Digital Speech. Digital Speech is randomly interrupted and thus tricks the hearing aid into "thinking" it is speech.High-end digital hearing aids sometimes have technology designed to reduce noise or enhance speech. Typically, these aids listen for continuous noise in the environment and lower the gain of the aid at the offending frequencies. Unfortunately, the aid also treats standard test signals, such as the Composite or pure-tone sweeps, as noise in its environment. In order to be able to accurate test these aids, we developed a modulated version of the composite signal called Digital Speech. Digital Speech is randomly interrupted and thus tricks the hearing aid into "thinking" it is speech.
52. Example of digital aid test This noise reducing digital aid was tested with both the composite and the digital speech signal. Notice how the digital speech signal causes the aid to produce more gain. This is because the signal is modulated and doesn't cause the aid to go into noise reduction mode.
This noise reducing digital aid was tested with both the composite and the digital speech signal. Notice how the digital speech signal causes the aid to produce more gain. This is because the signal is modulated and doesn't cause the aid to go into noise reduction mode.
53. Testing Open Fit Hearing Aids The Open Fit Coupler was designed to
Provide a realistic response for open fit hearing aids.
Provide an easy mechanism for attaching an open fit hearing aid to a coupler
The Open Fit Coupler is a non-standard sized coupler not designed to test to manufacturing specifications
54. Attaching the Open Fit Coupler This slide shows a comparison of a hearing aid frequency response measured with an open fit couper, an HA-1, and HA-2, and KEMAR.This slide shows a comparison of a hearing aid frequency response measured with an open fit couper, an HA-1, and HA-2, and KEMAR.
55. Testing Directionality Use chamber design to perform �forward� and �reverse� measurements to obtain directional advantage
Chamber speaker mounted at 45 degree angle, pointing towards left side of chamber
56. Forward/Reverse Positioning By positioning the hearing aid in the chamber in different configurations, it is possible to obtain the directional advantage of the hearing aid.By positioning the hearing aid in the chamber in different configurations, it is possible to obtain the directional advantage of the hearing aid.
57. Directional Advantage Curves 1 and 2 represent the �forward� and �reverse� responses of the directional hearing aid. Curves 1 and 2 represent the �forward� and �reverse� responses of the directional hearing aid.
58. Coupler Automation Set up own test sequence
Select signal type for each curve
Select signal amplitude for each curve
Add any desired pauses in test sequence
Save and auto load test sequence If there are a standard set of measurements that you would like to perform on a number of aids, you can use the 7000 Test System to develop your own automated test sequence. You can program the signal type and signal amplitude for up to ten curves. In Fully-Automatic mode, the analyzer will run through all these curves without stopping except at pre-programmed pauses. In Semi-Automatic mode, you manually control the Start and Stop buttons, but the analyzer will automatically select the next curve for you.
If there is a test sequence that you would like to use frequently, you can set the analyzer to automatically load that test sequence. You can even set the analyzer to automatically be in Fully-Automatic or Semi-Automatic mode when entering the Coupler Multicurve screen.If there are a standard set of measurements that you would like to perform on a number of aids, you can use the 7000 Test System to develop your own automated test sequence. You can program the signal type and signal amplitude for up to ten curves. In Fully-Automatic mode, the analyzer will run through all these curves without stopping except at pre-programmed pauses. In Semi-Automatic mode, you manually control the Start and Stop buttons, but the analyzer will automatically select the next curve for you.
If there is a test sequence that you would like to use frequently, you can set the analyzer to automatically load that test sequence. You can even set the analyzer to automatically be in Fully-Automatic or Semi-Automatic mode when entering the Coupler Multicurve screen.
59. Programming Auto Mode The F6 key is used to put the 7000 Test System into Program Mode. In Program Mode, you set up the source type, source level, and any other settings for each curve as usual. Afterwards each curve is set up, use the START or STOP keys to advance to the next curve � START tells the analyzer to advance without pausing when in fully-automatic mode. STOP tells the analyzer to advance to the next curve and pause.The F6 key is used to put the 7000 Test System into Program Mode. In Program Mode, you set up the source type, source level, and any other settings for each curve as usual. Afterwards each curve is set up, use the START or STOP keys to advance to the next curve � START tells the analyzer to advance without pausing when in fully-automatic mode. STOP tells the analyzer to advance to the next curve and pause.
60. Example of Auto Test This is an example of a programmed automatic test sequence. Digital speech measurements were made at 50, 65, and 80 dB SPL. A pure-tone sweep was made at 90 dB SPL.This is an example of a programmed automatic test sequence. Digital speech measurements were made at 50, 65, and 80 dB SPL. A pure-tone sweep was made at 90 dB SPL.
61. Saving and Loading Settings After using the F6 key in the Coupler Multicurve screen to save the programmed curve group into permanent memory, go to the Coupler Default Settings screen to set the analyzer to automatically load the saved curve group and put the analyzer into Auto Mode (Fully or Semi-Automatic) upon entry into the Coupler Multicurve screen.
This means you could turn on your analyzer, enter Coupler Multicurve screen, and just press [START] to run your automatic test sequence. No other key presses are necessary.After using the F6 key in the Coupler Multicurve screen to save the programmed curve group into permanent memory, go to the Coupler Default Settings screen to set the analyzer to automatically load the saved curve group and put the analyzer into Auto Mode (Fully or Semi-Automatic) upon entry into the Coupler Multicurve screen.
This means you could turn on your analyzer, enter Coupler Multicurve screen, and just press [START] to run your automatic test sequence. No other key presses are necessary.
62. Troubleshooter Profiler The Profiler is a great automated test that uses the Digital Speech signals. It is available with the NOAH Troubleshooter module.The Profiler is a great automated test that uses the Digital Speech signals. It is available with the NOAH Troubleshooter module.
63. Advanced Coupler Battery Current [F1]
Coupler I/O [F2]
Attack & Release [F3]
Enhanced DSP [F4]
Function key operations available in the Advanced Coupler Navigation Screen From the Opening Screen, use [F3] to enter the Advanced Coupler Screen. There are four Advanced Coupler screens, as shown in this slide. Use F1-F4 to enter the test screen.From the Opening Screen, use [F3] to enter the Advanced Coupler Screen. There are four Advanced Coupler screens, as shown in this slide. Use F1-F4 to enter the test screen.
64. Battery Current Screen Measure Battery Current as a function of frequency
Measure Battery Current as a function of amplitude
Estimate battery life of hearing aid The Battery Current screen is used to determine if the hearing aid battery current varies by frequency and/or amplitude. It also estimates the battery life of the hearing aid.The Battery Current screen is used to determine if the hearing aid battery current varies by frequency and/or amplitude. It also estimates the battery life of the hearing aid.
65. Battery Current Screen
66. Coupler I/O Test Results In the Coupler I/O screen, use the LEFT and RIGHT arrow keys to change the frequency. F5 is used to change the source type. Press START to run the I/O sweep.In the Coupler I/O screen, use the LEFT and RIGHT arrow keys to change the frequency. F5 is used to change the source type. Press START to run the I/O sweep.
67. Attack & Release Test Screen Visual time graph of Attack and Release tests
Scale graphs independently to zoom in on results
Use Composite or Pure-tone
Choose any frequency from 200-8000 Hz in 100 Hz intervals
Customize amplitudes used in tests The Attack & Release screen gives you detailed information on the attack and release behavior of the hearing aid. Time graphs are displayed of the aid�s response when going from a soft to loud signal (attack test), and when going from a loud to soft signal (release test). You can use any puretone signal between 200 and 8000 Hz in 100 Hz intervals, or you can use the Composite signal. The amplitudes of the �loud� and �soft� signals can also be customized in the local menu.The Attack & Release screen gives you detailed information on the attack and release behavior of the hearing aid. Time graphs are displayed of the aid�s response when going from a soft to loud signal (attack test), and when going from a loud to soft signal (release test). You can use any puretone signal between 200 and 8000 Hz in 100 Hz intervals, or you can use the Composite signal. The amplitudes of the �loud� and �soft� signals can also be customized in the local menu.
68. Attack & Release Results Zoom in on the attack and release test results by using the F6 and F7 key. This will allow you to see exactly what the aid is doing in response to changes in the amplitude of the source signal. Zoom in on the attack and release test results by using the F6 and F7 key. This will allow you to see exactly what the aid is doing in response to changes in the amplitude of the source signal.
69. Enhanced DSP Designed to measure the "group delay" of a DSP aid. In other words, the actual digital processing time of a hearing aid.
0 ms for analog aids
1-12 ms for DSP
Great way to check if aid is analog or DSP
Also tests the "phase" of a hearing aid. This is useful for binaural fittings. Are the aids working together? Enhanced DSP is one of the standard features of the 7000 Test System. It has two measurements: group delay and phase.Enhanced DSP is one of the standard features of the 7000 Test System. It has two measurements: group delay and phase.
70. Technical Details: Group Delay This is an abstract diagram of the process of performing the group delay measurement. The sound chamber delivers a single impulse to the aid. The analyzer measures the output from the aid of that impulse in order to determine how long it takes the aid to process the impulse.This is an abstract diagram of the process of performing the group delay measurement. The sound chamber delivers a single impulse to the aid. The analyzer measures the output from the aid of that impulse in order to determine how long it takes the aid to process the impulse.
71. Technical Details: Phase Phase measures the "pushing " and "pulling" of the vibrations of sound through the hearing aid circuit.Phase measures the "pushing " and "pulling" of the vibrations of sound through the hearing aid circuit.
72. Example This is an example of a typical pair of high-end digital aids. Notice the phase graphs are nearly identical. This is an indication the aids are in phase and working together properly.This is an example of a typical pair of high-end digital aids. Notice the phase graphs are nearly identical. This is an indication the aids are in phase and working together properly.
73. Thank you for your time! Please email kris@frye.com for more information.