Download

1 / 24
240 likes | 648 Vues
The Demographic Transition. What is the Demographic Transition?. The shift through four distinct stages. Rev. Thomas Malthus 1766-1834. In 1798 he published An Essay on the Principle of Population

E N D
What is the Demographic Transition? • The shift through four distinct stages.
Rev. Thomas Malthus 1766-1834 • In 1798 he published An Essay on the Principle of Population • Malthus was the first to sound the alarm that the world’s population was expanding more rapidly than food production.
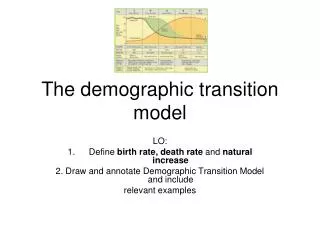
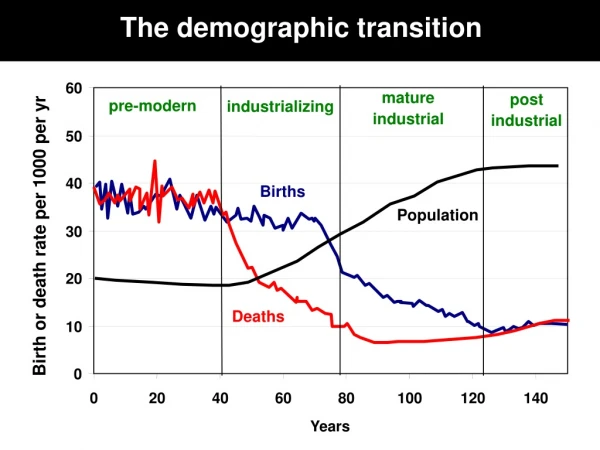
Birth rate Natural increase Death rate Time Note: Natural increase is produced from the excess of births over deaths. The Classic Demographic Transition Stage 1 Stage 2 Stage 3 Stage 4
Stage 1 - High Fluctuating • Birth Rate and Death rate are both high. Population growth is slow and fluctuating. • Reasons • Birth Rate is high as a result of: • Lack of family planning • High Infant Mortality Rate: putting babies in the 'bank' • Need for workers in agriculture • Religious beliefs • Children as economic assets • Death Rate is high because of: • High levels of disease • Famine • Lack of clean water and sanitation • Lack of health care • War • Competition for food from predators such as rats • Lack of education • Typical of Britain in the 18th century and the Least Economically Developed Countries (LEDC's) today.
Stage 1 • Death rates were very high at all times in this stage for a number of reasons, including: • Lack of knowledge of disease prevention and cure; • occasional food shortages. • Spikes in the rate of death were caused by outbreaks of infectious diseases such as influenza, scarlet fever, or plague. However, on a daily basis, it was primarily the lack of clean drinking water and efficient sewage disposal, and poor food hygiene that created an environment in which only a minority of children survived childhood. Water and food borne diseases such as cholera, typhoid, typhus, dysentery, and diarrhea were common killers, as were TB, measles, diphtheria, and whooping cough. Today in the developed world, at least, these are now minority causes of death.
Stage 2 - Early Expanding • Birth Rate remains high. Death Rate is falling. Population begins to rise steadily. • Reasons • Death Rate is falling as a result of: • Improved health care (e.g. Smallpox Vaccine) • Improved Hygiene (Water for drinking boiled) • Improved sanitation • Improved food production and storage • Improved transport for food • Decreased Infant Mortality Rates • Typical of Britain in 19th century; Bangladesh; Nigeria
Stage 3 - Late Expanding • Birth Rate starts to fall. Death Rate continues to fall. Population rising. • Reasons: • Family planning available • Lower Infant Mortality Rate • Increased mechanization reduces need for workers • Increased standard of living • Changing status of women • Typical of Britain in late 19th and early 20th century; China; Brazil.
Stage 4 - Low Fluctuating • Birth Rate and Death Rate both low. Population steady. • Economy is settled • Fully developed Middle Class • Political stability • Typical of USA; Sweden; Japan; Britain
Zero Population Growth When what is equal to what? The NIR is zero = ZPG
Making Population Real – Lesson Plan 2:The Demographic Transition What population patterns are revealed in the traditional Demographic Transition model? Assignment: • Construct a graph of birth and death rates in England from 1750-2000.
Making Population Real – Lesson Plan 2:The Demographic Transition
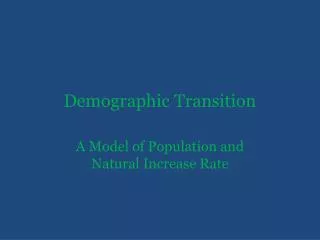
Births/Deaths per 1,000 1750 Sources: B.R. Mitchell, European Historical Statistics 1750-1970 (1976): table B6; Council of Europe, Recent Demographic Developments in Europe 2001 (2001): tables T3.1 and T4.1; CELADE, Boletin demografico 69 (2002): tables 4 and 7; Francisco Alba-Hernandez, La poblacion de Mexico (1976): 14; and UN Population Division, World Population Prospects: The 2002 Revision (2003): 326. Demographic Transition in Sweden and Mexico
Is the Demographic Transition Model Still Useful? • How well does the classic model work? • Is it a useful framework for developing countries? • Do developing countries need to share the experiences of Europe and the United States? • Is the socioeconomic change experienced by industrialized countries a prerequisite or a consequence of demographic transition?
Is the model universally applicable? • Like all models, the demographic transition model has its limitations. It failed to consider, or to predict, several factors and events: • 1 Birth rates in several MEDCs have fallen below death rates (Germany, Sweden). This has caused, for the first time, a population decline which suggests that perhaps the model should have a fifth stage added to it. • 2 The model assumes that in time all countries pass through the same four stages. It now seems unlikely, however, that many LEDCs, especially in Africa, will ever become industrialized.
Continued • 3 The model assumes that the fall in the death rate in Stage 2 was the consequence of industrialization. Initially, the death rate in many British cities rose, due to the insanitary conditions which resulted from rapid urban growth, and it only began to fall after advances were made in medicine. The delayed fall in the death rate in many developing countries has been due mainly to their inability to afford medical facilities. In many countries, the fall in the birth rate in Stage 3 has been less rapid than the model suggests due to religious and/or political opposition to birth control (Brazil), whereas the fall was much more rapid, and came earlier, in China following the government-introduced ‘one child’ policy. The timescale of the model, especially in several South-east Asian countries such as Hong Kong and Malaysia, is being squashed as they develop at a much faster rate than did the early industrialized countries. • 4 Countries that grew as a consequence of emigration from Europe (USA, Canada, Australia) did not pass through the early stages of the model.