Download
1 / 35
350 likes | 356 Vues
UW- Madison Geology 777. Electron Probe Microanalysis EPMA. WDS II: Spectrometers and Spectra. UW- Madison Geology 777. Key points.

E N D
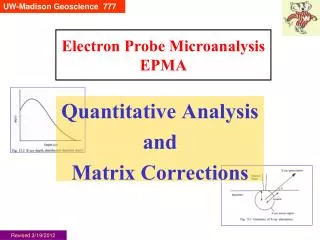
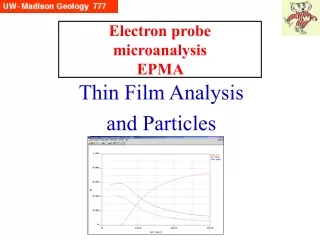
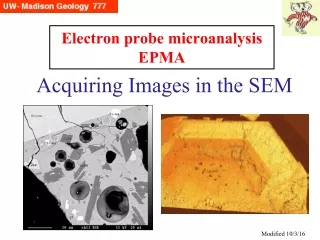
UW- Madison Geology 777 Electron Probe MicroanalysisEPMA WDS II: Spectrometers and Spectra
UW- Madison Geology 777 Key points X-rays are dispersed by a crystal with only one wavelength (nl) reflected (=diffracted), with that one wavelength (nl) passed to the detector.This is a monochrometer. Recall that n can be >1, so other elements can cause interference if their wavelengths are at an integral fraction of the desired wavelength. The detector is a gas-filled (sealed or flow-through) tube where gas is ionized by X-rays, yielding a massive multiplication factor (‘proportional counter’) X-ray focusing assumes geometry known as the Rowland Circle Key features of WDS are high spectral resolution and low detection limits
UW- Madison Geology 777 The typical electron microprobe has vertically mounted spectrometers (a), i.e. the Rowland circle is vertical. This orientation permits up to 5 spectrometers to be mounted around the column, as well as having room for an EDS detector. In this orientation, X-ray intensities are susceptible to small differences in the Z position of the sample (= X-ray defocusing, not good). We use polished planar samples, and focus the sample Z with reflected light. Spectrometers- Orientation There are some applications (e.g., industry) where the probe is utilized in production, and samples are rough surfaces. For this specialized situation, the spectrometer can be inclined(b), which then permits X-ray diffraction from a range of heights, all now on the inclined Rowland circle. However, only 2 inclined spectrometers will then fit around the column. Reed, 1993, Fig. 6.9, p. 70.
UW- Madison Geology 777 Focussing Geometry • The point source of X-rays in the electron microprobe is not optimally diffracted by a flat crystal, where only a small region is “in focus” for the one wavelength of interest. • X-ray intensities are improved by adding curvature to the crystals: • Johann geometry: the crystal is bent/curved to a radius 2r (=diameter of Rowland circle); • Johansson geometry: the crystal is curved to 2r, and the surface is ground to r. This is a difficult process, so most crystals have Johann geometry. Reed, 1993, p. 67.
UW- Madison Geology 777 Temperature Dependence • We attempt to keep a constant temperature in the probe lab, around 68°F (20°C). This is also the temperature of the chilled water that circulates both through the electronic cabinet as well as the column (and outer jacket of diffusion pump). • Two aspects of the instrument are sensitive to temperature changes – the spectrometer crystals, and the detector P10 gas. • Spectrometer crystals have a linear expansion coefficient, and expansion will change the 2d. The effect upon PET is 4x worse than upon LIF, and increases rapidly with increasing sin q. • P10 gas pressure must be constant, as this is critical to having reproducibility in counting rates between the standards and the unknowns, both over short time spans as well as longer (e.g. 24 hour) durations. (Loss of air conditioning on very hot summer days precludes probing.)
UW- Madison Geology 777 WDS provides roughly an order of magnitude higher spectral resolution (sharper peaks) compared with EDS. Plotted here are resolutions of the 3 commonly used crystals, with the x-axis being the characteristic energy of detectable elements. Note that for elements that are detectable by two spectrometers (e.g., Y La by TAP and PET, V Ka by PET and LIF), one of the two crystals will have superior resolution. When there is an interfering peak and you want to try to minimize it, this knowledge comes in very handy. Spectral Resolution Reed, 1995, Fig 13.11, in Williams, Goldstein and Newbury (Fiori volume)
UW- Madison Geology 777 The intensity of a WDS spectrometer is a function of the solid angle subtended by the crystal, reflection efficiency, and detector efficiency. Reed (right) compared empirically the efficiency of various crystals vs EDS. However,the curves represent generation efficiency (recall overvoltage) and detection effeciency. Spectrometer Efficiency Reed suggests that the WDS spectrometer has ~10% the collection efficiency relative to the EDS detector. How to explain the curvature of each crystal’s intensity function? At high Z, the overvoltage is presumably minimized (assuming Reed is using 15 or 20 keV). Low Z equates larger wavelength, and thus higher sinq, and thus the crystal is further away from the sample, with a smaller solid angle. Reed, 1996, Fig 4.19, p. 63
Bkg under peak High bkg Low bkg UW- Madison Geology 777 Spectrum =Characteristic + continuum Recall that the X-rays generated by electron bombardment are both characteristic of each element present in the specimen, as well as the broadband “continuum”. And recall that the background level increases with increasing mean atomic number of the specimen. In EPMA, several steps must occur. First, the peak position must be precisely found. Then, trustworthy background positions must be found in order to model the background level at the peak position. Above, the Mg ka peak position is at the white (center) line and we need to determine where adjacent to it would be the best places to measure the background level, in order to calculate (model) the continuum level under the peak..
Bkg under peak High bkg Low bkg UW- Madison Geology 777 Probe for Windows Peak and Background displays Our software provides handy ways to store wavescans. The standard procedure is to peak the elements of interest and use either default background positions or ones previously chosen. The displayed wavescans have a central line that is white. This is the peak of interest (here, Mg Ka).Background positions are shown by yellow lines. If a background position has been changed, the old position is shown in magenta.The “background model” is a line, here red (normally yellow).
Bkg under peak High bkg Low bkg UW- Madison Geology 777 Background model Determining the background offset positions is important, as other peaks may ‘accidentally’ fall where you originally plan to take backgrounds. Above, the low default background (purple) was found upon examination to be near a peak, and was moved further to the left. There are many background models that can be used; above, the background (red) is ‘linear” extrapolation from 2 points on the spectrum (yellow locations).
UW- Madison Geology 777 Curved background-1 There are some cases where the background has a curvature, particularly at low sin theta A linear model (below) results in too high calculated background. .
Curved background-2 An exponential curved background, however, provides a better result. Note the presence of several other background models in the right box.
UW- Madison Geology 777 In some (many) cases, adjacent peaks can interfere with either high or low background position, requiring same side backgrounds: here, average of 2 measurements on the high side. Highest peak is 3rd order Ca Ka. Congested backgrounds
Background Offsets How far away from the peak should the background offsets be? Reed demonstrates mathematically (adjacent figure) that a small overlap on the tails of the peak ends up making no significant difference. However, he warns (and it is my experience) that being too close to the peak is not good practice, and should only be done in extreme cases where it is impossible to find a ‘free area’ in the adjacent background. Reed, 1993, p. 150
This is an EDS view of the absorp;tion edge. To translate to WDS (wavelength or sin q), just reverse the axes. UW- Madison Geology 777 Backgrounds and Absorption Edges You need to be aware of potential for error if you position your low background too far to the left (low sinq, short wavelength), below the absorption edge of the element you are measuring. For the K edges, this is at the Kb position. The background level to the low sinq (=higher energy) side of the edge will be depressed because these continuum X-rays have energies great enough to be “used up” causing secondary fluorescence of the element in question, and thus produce a misleadingly low background. If a low background position between the peak and absorption edge can’t be taken, then only measurements on the high side should occur. “These considerations do not apply to small peaks for which the associated absorption step is negligible.”–Reed, 1993, p. 151
UW- Madison Geology 777 Analysts need to understand the possible implications of the Ar absorption edge (recall Ar is in the detector P10 gas). A certain fraction of X-rays with energy lower than the argon K edge (3.202 keV) will pass through the gas without interaction. However, for X-rays with energies > 3.202 keV, approximately twice as many will interact with the gas and be detected. Ar Absorption Edge From Paul Carpenter’s talk at April 2002 NIST-MAS EPMA workshop • Lines of the same family that fall on either side will have ‘abnormal’ proportions–normally the La > Lb, but for Cd, it is reversed due to this. • Trace element studies utilizing the U Ma line must utilize only background offsets on the high sinq side of the peak (see figure above).
Au La peak position UW- Madison Geology 777 Holes in the Background-1 In 1987, Bruce Robinson (Australia) reported on a phenomenon uncovered during examination of arsenopyrite for trace amounts of gold. After looking at unknowns, he checked a reference arsenopyrite that should have had no Au in it – but it showed 100 ppm. High resolution scan of the background near the Au La peak on the LIF crystal showed a distinct drop (trough) by ~10% relative to the adjacent background. With an incorrect (artifically “low”) background, zero Au had become 100 ppm Au. From Remond et al, 2002, NIST Journal of Research
Au La peak position UW- Madison Geology 777 Holes in the Background-2 These holes or ‘negative peaks’ are caused by reflections of the continuum X-rays from planes in the crystal other than the correct plane (the 200 in LIF). These X-rays do not reach the counter. The point is that when you are looking for very low detection levels, it pays to pay very close attention to the shape of the background and to try to understand it well. And to have some well characterized secondary standards to evaluate your procedure with.
UW- Madison Geology 777 On Peak Interferences Users must be vigilant for interferences upon the peaks being measured, both in the unknowns and in the standards. The figure to the right shows an interference type seen where peak B overlaps peak A. For elements whose wavelengths can be diffracted by a choice of 2 crystals, one will be better for spectral resolution (the lower 2d, with higher sin theta position). Reed, 1993, p. 153
UW- Madison Geology 777 On Peak Interference-Slight REE analysis is particularly tricky, since there are so many elements present and there are so many L lines.Here the high side tail of Ce Lb1 interferes with Nd La.
UW- Madison Geology 777 Interference Correction We must correct for interferences, by software options, if we have standards that have the interfering element (here Ce) but none of the interfered with element (here Nd). During count acquisition (“calibration” or “standardization”) on the Ce standard (356), we also acquire interference counts at the Nd La peak position. Then during analysis of unknowns, an appropriate correction is made for the overlap.
UW- Madison Geology 777 Peak Centering-1 Quantitative analysis requires knowledge of the peak intensity, which is a function of the composition of the specimen.We could also use the integrated area of the peak, but that is time-consuming. The peak position is first determined upon either the specimen or the standard, with the general assumption that the position is the same (with important exceptions!). Then that position (and user-determined background offsets) are utilized in the automated movement of the spectrometers during analysis.
UW- Madison Geology 777 Peak Centering-2 There are several methods possible to find the peak center. In times past, manual searching was done (aided by an audio device whose pitch increased as counts increased). Today we have automated peaking routines. We have developed a routine of (1) using one of the top 3 methods (usually the fast ROM) to get pretty close to the peak, and then (2) a “post-scan” across the top of the peak that allows the operator the final decision of picking the optimal peak position. (This option was added based upon detailed peak scans done by 777 students in the Fall of 2002.)
UW- Madison Geology 777 It is very important to start with the “best” peak position, which means the center of the peak (usually the highest counts – though not necessarily). At the right are two “post-scans” where the red vertical line is the position selected by the ROM automation—very good for the Si Ka position, but about 7 units too high for Al Ka. The “post-scan” option gives the operator the freedom to over-ride the computer’s best guess with an intelligent decision. Best operating practice calls for picking the center of the peak centroid, because there may be slight offsets developed over a probe session due to mechanical drift and there is also the question of real peak shifts; by starting in the dead center, these variables should be minimized. Peak Centering-3
UW- Madison Geology 777 X-ray Peaks - Poisson Distribution X-ray peaks follow a Poisson distribution, which describes the counting of events that occur at random but at a definite average rate. “It can be shown” that for a Poisson distribution, the standard deviation is the square root of the counts. The Poisson distribution is similar to, but different from the Gauss distribution. The Gauss distribution is bell shaped and symmetrical about its mean value, while the Poisson distribution has neither of these properties in general. John R. Taylor, An Introduction to Error Analysis, 2nd Ed., 1997. p. 245-256
Satellites in spectrum of pure Si with PET at 20 keV. UW- Madison Geology 777 Satellites In the X-ray tables, you see lines with an “S” in front, e.g; SKa3. These are called “non-diagram’ lines because they are not caused by the usual process where the ‘normal’ target atom loses one electron. Instead they come from a state where the atom is doubly ionized, by whatever process (e.g. Auger electron production). Because there are less electrons present ‘orbiting the nucleus’, there is less screening of the positive charge of the nucleus, so the remaining electrons have a slightly higher binding energy. So a characteristic X-ray produced by knocking one of them out will have a slightly higher energy, or lower wavelength, than a ‘normal’ X-ray of that atom. Goldstein et al, 1992, Fig 6.16, p. 363
PbS BaSO4 UW- Madison Geology 777 Al Ka Peaks Shifts in peak shape of certain elements can occur due to difference in chemical bonding, between different samples/standards. Some well understand examples are Al Ka and S ka, as well as P ka, and the “light” element K lines. Articles have been published that show evidence of peak shifts of Si and Al kb as well as Fe La/Lb in relation to valence/bonding. Peak Shifts-1
UW- Madison Geology 777 These shifts can be understood if you understand that a characteristic peak is actually a cumulative sum of several discrete peaks which the spectrometer may not resolve, though many times one can discern humps within each peak. Peak Shifts-2 Figures from Remond et al, 2002, NIST Journal of Research
UW- Madison Geology 777 Peak Shifts-3 Over the past year I have been trying to track down the cause of some errors in silicate analyses (e.g., totals of <99 vs 100 wt%). Silica Ka is clearly a very important peak to “get right”. There appears to be a ~5 unit shift , with garnet and enstatite higher than opx, with the Fo90 olivine in between. This could explain a 1-2% deficiency. There is some theoretical basis for this: the Ka1 and Ka2 peaks may have different weights (John Armstrong, pers. comm. 9/25/03)
UW- Madison Geology 777 If unrecognized, shifts can affect the X-ray intensity measured at the defined “peak center position”, producing errors. This is predominately an effect on the “light elements” (B, C, N, O, F) where the valence electrons are involved in X-ray production. Peak Shifts-4 We will discuss this further in the section on “Light element analysis”, referring to (1) integration under the peak, and (2) Area Peak Factors. Work in progress here: L lines of elements like Co apparently have peak shifts. Excellent article on this subject is Remond et al, from the NIST 2202 Journal. A pdf file is on the Geol 777 web site.
UW- Madison Geology 777 Identifying Lines in Spectra In “normal” WDS quantitataive analysis, the analyst is concerned with a pre-determined set of elements defined by previous knowledge. You focus only upon these elements. However, there are times when you must identify unknown elements. EDS is a quick way to search for elements; however, there are limitations with EDS, and you may then turn to WDS scans. The easiest is running through a small list of elements (looking for a peak for each), but if this fails, you must do full wave scans on all the spectrometers, and manually identify the peaks (using the X-ray database in the software to assist). There is an optimal order for doing this identification of peaks.
UW- Madison Geology 777 Guidelines for WDS peak ID-1 1. Always start with the shortest wavelengths, where you have the highest chance of finding first order (n=1) peaks. These will be on the crystal with the lowest 2d, the LIF crystal. Spectra on the other crystals may have higher order reflections of elements present here. 2. Identify the highest intensity peak at the low wavelength end of LIF. It should be a Ka or La peak. If you find such a peak, you immediately assume that you will find a related “family of lines”, such as Kb or Lb1, Lb2 , Lb3 , Lb4 etc –you immediately look for them on all the crystals. The rough ratio of Ka to Kb is 10:1, and La to Lb1 is 2:1.You can also use this relationship to exclude some lines; e.g. a peak at 1.176Å could be either As Ka or Pb La. Inspection shows there is no As Kb, but there are other Pb L lines. Thus, the peak is due to Pb.
UW- Madison Geology 777 Guidelines for WDS peak ID-2 3. If you find a strong K line, you will probably also find some L lines of that element. And if you find a strong L line, you could also find some M lines.They may be on a different crystal. 4. Once all first order elements found initially from of the LIF spectrum have been identified and all’family member’ peaks on all spectra checked off, then all possible higher order peaks need to be accounted for. 5. Only now should you proceed to the next unidentified high intensity, low wavelength peak, repeating steps 1-4. Then continue repeating until all peaks are identified.
UW- Madison Geology 777 Virtual WDS “Virtual WDS” is a very useful program that utilizes stored EPMA spectra, to model potential interferences offline, prior to a probe session.
UW- Madison Geology 777 Virtual WDS - Ti on V interference Here we can model the overlap of Ti kb upon V ka on either PET (left) or LIF (right), visualizing the individual peaks (top) and a realistic combined peak (bottom). Clearly, the LIF crystal should be used.