Download
1 / 1
10 likes | 121 Vues
(3) (4). a. b. b. b. Economic Evaluation of Optimal Nitrogen Application in Texas Cotton Production Prashant Amatya 1 , Mark Yu 2 , and Frank Ewell 3 .

E N D
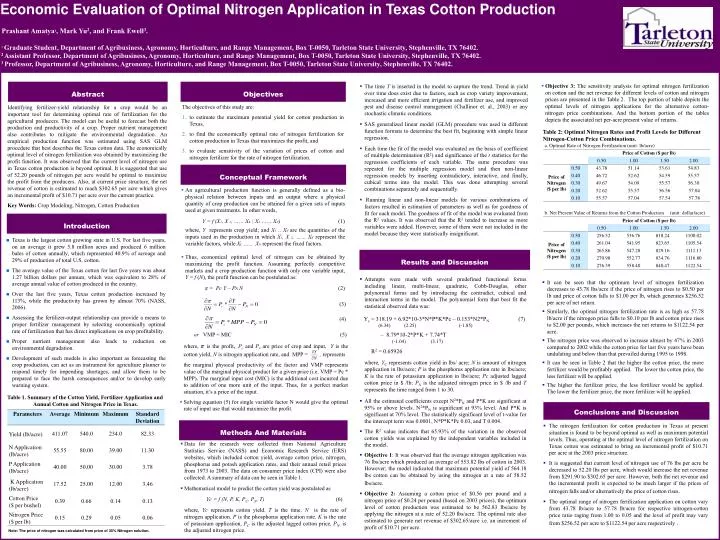
(3) (4) a b b b Economic Evaluation of Optimal Nitrogen Application in Texas Cotton Production Prashant Amatya1, Mark Yu2, and Frank Ewell3. 1Graduate Student, Department of Agribusiness, Agronomy, Horticulture, and Range Management, Box T-0050, Tarleton State University, Stephenville, TX 76402. 2 Assistant Professor, Department of Agribusiness, Agronomy, Horticulture, and Range Management, Box T-0050, Tarleton State University, Stephenville, TX 76402. 3 Professor, Department of Agribusiness, Agronomy, Horticulture, and Range Management, Box T-0050, Tarleton State University, Stephenville, TX 76402. • Objective 3: The sensitivity analysis for optimal nitrogen fertilization on cotton and the net revenue for different levels of cotton and nitrogen prices are presented in the Table 2. The top portion of table depicts the optimal levels of nitrogen applications for the alternative cotton-nitrogen price combinations. And the bottom portion of the tables depicts the associated net per-acre present value of returns. Abstract Objectives • The time T is inserted in the model to capture the trend. Trend in yield over time does exist due to factors, such as crop variety improvement, increased and more efficient irrigation and fertilizer use, and improved pest and disease control management (Challinor et. al., 2003) or any stochastic climatic conditions. • SAS generalized linear model (GLM) procedure was used in different function formats to determine the best fit, beginning with simple linear regression. • Each time the fit of the model was evaluated on the basis of coefficient of multiple determination (R2) and significance of the t statistics for the regression coefficients of each variable. The same procedure was repeated for the multiple regression model and then non-linear regression models by inserting contradictory, interactive, and finally, cubical terms into the model. This was done attempting several combinations separately and sequentially. • Running linear and non-linear models for various combinations of factors resulted in estimation of parameters as well as for goodness of fit for each model. The goodness of fit of the model was evaluated from the R2 values. It was observed that the R2 tended to increase as more variables were added. However, some of them were not included in the model because they were statistically insignificant. The objectives of this study are: to estimate the maximum potential yield for cotton production in Texas, to find the economically optimal rate of nitrogen fertilization for cotton production in Texas that maximizes the profit, and to evaluate sensitivity of the variation of prices of cotton and nitrogen fertilizer for the rate of nitrogen fertilization. Identifying fertilizer-yield relationship for a crop would be an important tool for determining optimal rate of fertilization for the agricultural producers. The model can be useful to forecast both the production and productivity of a crop. Proper nutrient management also contributes to mitigate the environmental degradation. An empirical production function was estimated using SAS GLM procedure that best describes the Texas cotton data. The economically optimal level of nitrogen fertilization was obtained by maximizing the profit function. It was observed that the current level of nitrogen use in Texas cotton production is beyond optimal. It is suggested that use of 52.20 pounds of nitrogen per acre would be optimal to maximize the profit from the producers. Also, at current price structure, the net revenue of cotton is estimated to reach $302.65 per acre which gives an incremental profit of $10.71 per acre over the current practice. Key Words: Crop Modeling, Nitrogen,Cotton Production Table 2:Optimal Nitrogen Rates and Profit Levels for Different Nitrogen-Cotton Price Combinations. Conceptual Framework • An agricultural production function is generally defined as a bio-physical relation between inputs and an output where a physical quantity of crop production can be attained for a given sets of inputs used at given treatments. In other words, Y = f (X1, X 2, …… XK | XL …… XN) (1) where, Y represents crop yield; and X1 .. XNare the quantities of the inputs used in the production in which X1, X 2, …… XK represent the variable factors, while XL …... XN represent the fixed factors. • Thus, economical optimal level of nitrogen can be obtained by maximizing the profit function. Assuming perfectly competitive markets and a crop production function with only one variable input, Y = f (N), the profit function can be postulated as: • π = Pc Y – PNN (2) b b b a b b Introduction • Texas is the largest cotton growing state in U.S. For last five years, on an average it grew 5.8 million acres and produced 6 million bales of cotton annually, which represented 40.9% of acreage and 29% of production of total U.S. cotton. • The average value of the Texas cotton for last five years was about 1.27 billion dollars per annum, which was equivalent to 28% of average annual value of cotton produced in the country. • Over the last five years, Texas cotton production increased by 113%, while the productivity has grown by almost 70% (NASS, 2006). • Assessing the fertilizer-output relationship can provide a means to proper fertilizer management by selecting economically optimal rate of fertilization that has direct implications on crop profitability. • Proper nutrient management also leads to reduction on environmental degradation. • Development of such models is also important as forecasting the crop production, can act as an instrument for agriculture planner to respond timely for impending shortages, and allow them to be prepared to face the harsh consequences and/or to develop early warning system. Results and Discussion • Attempts were made with several predefined functional forms including linear, multi-linear, quadratic, Cobb-Douglas, other polynomial forms and by introducing the contradict, cubical and interaction terms in the model. The polynomial form that best fit the statistical observed data was: • Yc = 318.19+ 6.92*10-3*N*P*K*Pc – 0.153*N2*PN(7) (6.34) (2.25) (-1.85) – 8.79*10-2*P*K + 7.74*T (-1.04) (3.17) R2 = 0.65926 where, YC represents cotton yield in lbs/ acre; N is amount of nitrogen application in lbs/acre; P is the phosphorus application rate in lbs/acre; K is the rate of potassium application in lbs/acre; Pc adjusted lagged cotton price in $ /lb; PN is the adjusted nitrogen price in $ /lb and T represents the time ranged from 1 to 30. • All the estimated coefficients except N2*PN and P*K are significant at 95% or above levels. N2*PN is significant at 93% level. And P*K is significant at 70% level. The statistically significant level of t-value for the intercept term was 0.0001, N*P*K*Pc 0.03, and T 0.004. • The R2 value indicates that 65.93% of the variation in the observed cotton yields was explained by the independent variables included in the model. • Objective 1: It was observed that the average nitrogen application was 76 lbs/acre which produced an average of 553.82 lbs of cotton in 2003. However; the model indicated that maximum potential yield of 564.18 lbs cotton can be obtained by using the nitrogen at a rate of 58.52 lbs/acre. • Objective 2: Assuming a cotton price of $0.56 per pound and a nitrogen price of $0.24 per pound (based on 2003 prices), the optimum level of cotton production was estimated to be 562.83 lbs/acre by applying the nitrogen at a rate of 52.20 lbs/acre. The optimal rate also estimated to generate net revenue of $302.65/acre i.e. an increment of profit of $10.71 per acre. • It can be seen that the optimum level of nitrogen fertilization decreases to 43.78 lbs/acre if the price of nitrogen rises to $0.50 per lb and price of cotton falls to $1.00 per lb, which generates $256.52 per acre of net return. • Similarly, the optimal nitrogen fertilization rate is as high as 57.78 lb/acre if the nitrogen price falls to $0.10 per lb and cotton price rises to $2.00 per pounds, which increases the net returns to $1122.54 per acre. • The nitrogen price was observed to increase almost by 47% in 2003 compared to 2002 while the cotton price for last five years have been undulating and below than that prevailed during 1995 to 1998. • It can be seen in Table 2 that the higher the cotton price, the more fertilizer would be profitably applied. The lower the cotton price, the less fertilizer will be applied. • The higher the fertilizer price, the less fertilizer would be applied. The lower the fertilizer price, the more fertilizer will be applied. • or VMP = MIC (5) • where, π is the profit, Pcand PNare price of crop and input, Y is the cotton yield, N is nitrogen application rate, andMPP =,represents the marginal physical productivity of the factor and VMP represents value of the marginal physical product for a given price (i.e. VMP = Pc * MPP). The marginal input cost (MIC) is the additional cost incurred due to addition of one more unit of the input. Thus, for a perfect market situation, it’s a price of the input. • Solving equation (5) for single variable factor N would give the optimal rate of input use that would maximize the profit. Table 1.Summary of the Cotton Yield, Fertilizer Application and Annual Cotton and Nitrogen Price in Texas. Conclusions and Discussion MethodsAnd Materials • The nitrogen fertilization for cotton production in Texas at present situation is found to be beyond optimal as well as maximum potential levels. Thus, operating at the optimal level of nitrogen fertilization on Texas cotton was estimated to bring an incremental profit of $10.71 per acre at the 2003 price structure. • It is suggested that current level of nitrogen use of 76 lbs per acre be decreased to 52.20 lbs per acre, which would increase the net revenue from $291.90 to $302.65 per acre. However, both the net revenue and the incremental profit is expected to be much larger if the prices of nitrogen falls and/or alternatively the price of cotton rises. • The optimal range of nitrogen fertilization application on cotton vary from 43.78 lb/acre to 57.78 lb/acre for respective nitrogen-cotton price ratio raging from 1.00 to 0.05 and the level of profit may vary from $256.52 per acre to $1122.54 per acre respectively. • Data for the research were collected from National Agriculture Statistics Service (NASS) and Economic Research Service (ERS) websites, which included cotton yield, average cotton price, nitrogen, phosphorus and potash application rates, and their annual retail prices from 1973 to 2003. The data on consumer price index (CPI) were also collected. A summary of data can be seen in Table 1. • Mathematical model to predict the cotton yield was postulated as Yc = f (N, P, K, PC, PN, T) (6) where, Yc represents cotton yield. T is the time. N is the rate of nitrogen application. P is the phosphorus application rate. K is the rate of potassium application, PC is the adjusted lagged cotton price, PN. is the adjusted nitrogen price. a b b Note: The price of nitrogen was calculated from price of 30% Nitrogen solution.