Download
1 / 37
400 likes | 668 Vues
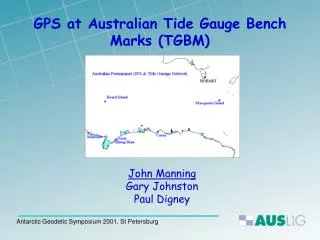
OTT “ KALESTO ” RADAR TIDE GAUGE. By Ms R. FARRE BSC SEA EGS SUPERINTENDENT TIDAL INFORMATION SOUTH AFRICAN NAVY HYDROGRAPHIC OFFICE. AIM. SCOPE: RSA Tide Gauge Network Leveling the Transducer Surveying and Calibration Benchmarks

E N D
OTT “KALESTO” RADAR TIDE GAUGE By Ms R. FARRE BSC SEA EGS SUPERINTENDENT TIDAL INFORMATION SOUTH AFRICAN NAVY HYDROGRAPHIC OFFICE
SCOPE: • RSA Tide Gauge Network • Leveling the Transducer • Surveying and Calibration • Benchmarks • How to survey in a Tide Gauge • Davit • LOGOSENS reference level • Long and short stay • HYDRAS3 • WBSLAO – LOGOSENS operating program
LEVELING THE TRANSDUCER • THE TRANSDUCER NEEDS TO BE LEVELLED ON THE DAVIT • Spirit level
SCOPE: • RSA Tide Gauge Network • Leveling the Transducer • Surveying and Calibration • Benchmarks • How to survey in a Tide Gauge • Davit • LOGOSENS reference level • Long and short stay • HYDRAS3 • WBSLAO – LOGOSENS operating program
SURVEYING AND CALIBRATION • AFTER INSTALLATION: • Gauge must be levelled into local benchmark network and a reference level programmed into the logosens. • Must know • Exact height of benchmarks above LLD • what LLD is. • IN RSA LLD = MSL = 0 • Anything above MSL is height or elevation • Anything below MSL is a depth. • THUS BENCHMARKS ARE HEIGHTS ABOVE MSL • CD IS LAT CD IS VALUE BELOW MSL • Durban CD is MSL – 0.913
SURVEYING AND CALIBRATION • SO A BENCHMARKS HEIGHT CAN BE CONVERTED TO A HEIGHT ABOVE CD • Height of benchmark above MSL + CD for the port • A + C = B
SURVEYING AND CALIBRATION • IDENTIFY BENCHMARKS AND CHECK THEIR LOCATION WITH A SITE MAP (left) • BENCHMARK HEIGHTS CAN BE OBTAINED FROM • LAND SURVEYOR • TOWN PLANNERS OFFICE • WF9 = MSL + 2.331m • WF10 = MSL + 2.343m • NEW GPS = MSL + 2.329m
SURVEYING AND CALIBRATION • THE TRIPOD, WITH DUMPY, MUST BE POSITIONED ½ WAY BETWEEN EACH BENCHMARK. • THE TACH STAFF WILL BE PLACED ON THE BENCHMARK STUD STUD
SURVEYING AND CALIBRATION • SURVEYOR STANDS AT POSITIONS 1, 2 & 3 • PERSON HOLDING THE TACH STAFF PLACES IT ON THE BENCHMARKS MARKED 1, 2, 3 & ON THE TIDE GAUGE TRANSDUCER AT 4
SURVEYING AND CALIBRATION • YOU STAND AT 1 • ASSISTANT AT 1 • Take readings • YOU TURN, WITHOUT MOVING THE TRIPOD, TO 2 • ASSISTANT MOVES TO 2 • Take readings • YOU MOVE TO 2 • ASSIATANT STAYS AT 2, TURNING TO FACE YOU WITHOUT LIFTING THE TACH STAFF OFF THE BENCHMARK STUD • Take readings.
SURVEYING AND CALIBRATION • YOU TURN, WITHOUT MOVING THE TRIPOD, TO 3 • ASSISTANT MOVES TO 3 • Take readings • YOU MOVE TO 3 • ASSISTANT STAYS AT 3, TURNING TO FACE YOU WITHOUT LIFTING THE TACH STAFF OFF THE BENCHMARK STUD • Take readings.
SURVEYING AND CALIBRATION • YOU TURN, WITHOUT MOVING THE TRIPOD, TO 4 • ASSISTANT MOVES TO 4 • Take readings • Repeat this process “LEAP-FROGGING” back to where you will be taking reading with the tach staff on position 1 • IF CORECTLY DONE: • Forward = Backward • Forward Readings – Backward Readings = 0
SURVEYING AND CALIBRATION • WHEN PLACING THE TACH STAFF ON THE TRANSDUCER • Always place it on the “black box” • Never on the bracket. • YOU CAN GET THE STD TACH STAFF (1) • Graduations that can be read off manually • AND THE ELECTRONIC TACH STAFF (2) • Barcoded (2) (1)
SURVEYING AND CALIBRATION EXAMPLE OF SURVEY RESULTS FOR RICHARDS BAY, Northern Kwazulu Natal
MEASUREMENTS OF THE “KALESTO” RADAR GAUGE • FROM TOP OF “BLACK BOX” TO THE TRANSDUCER FACE (Tx) IS 0.400m
“KALESTO” RADAR GAUGEPLATFORM FOR EASY ACCESS TO GAUGE DURING LEVELING AND CALIBRATION. (Richards Bay)
CALIBRATION OF “KALESTO” East London Knysna Richard’s Bay Simon’s Town
CALIBRATING THE “KALESTO” RADAR GAUGE • Example of a calculation for check calibration of radar gauge, if A= 3.422m (known value for local benchmark) • Av. A above CD = Av B Av A =MSL + 3.422 (D-B) = + 1.063 less E to Tx = - 0.400 Ref Face =MSL + 4.085 CD =MSL - 1.015 +5.100 Ht of Tx = 5.100m above CD • readings @ short stay: 5.100 - (2.750 - 0.400) = 2.750m • readings @ long stay: 5.100 - (3.750 - 0.400) = 1.750m
CALIBRATING THE “KALESTO” RADAR GAUGE • Program the reference level into the LOGOSENS • With RS232 cable • Create station in the office before departure to the installation site. Show how this is done with WBSLAO program
CALIBRATING THE “KALESTO” RADAR GAUGE • AT SHORT STAY: • From 1300B to 1900B • No values: 125 • Mean: 1.715m above CD • This is 0.035m LOW • ADD 0.035m to ref in LOGOSENS
CALIBRATING THE “KALESTO” RADAR GAUGE • AT LONG STAY: • From 1925B to 0900B next day • No values: 272 • Mean: 2.718m above CD • This is 0.032m LOW • ADD 0.032m to ref in LOGOSENS
CALIBRATING THE “KALESTO” RADAR GAUGE • After resetting the reference level in the LOGOSENS • AT LONG STAY: • From 0935B to 0955B • No values: 7 • Mean: 2.753m above CD • This is 0.003m HIGH • This 3mm is perfectly acceptable to be out by.
CALIBRATING THE “KALESTO” RADAR GAUGE • This is how the previous information would be displayed once it is downloaded for a longer period of time. • Calibration records are digitally stored in this method.
SOME USEFUL TIPS • Always print weekly graphics. • Errors can be noted and corrected timeously • Battery not working • No power • Telephone lines down • Assists with analysis of tides • Shows “spikes” very clearly. • Insert your predictions into the HYDRAS3 program • Check accuracy of your predictions • Overlay actual and predictions • Can pick up time/ clock errors timeously
OTT “KALESTO” RADAR TIDE GAUGE • SCOPE: • RSA Tide Gauge Network • Leveling the Transducer • Surveying and Calibration • Benchmarks • How to survey in a Tide Gauge • Davit • LOGOSENS reference level • Long and short stay • HYDRAS3 • WBSLAO – LOGOSENS operating program
EXAMPLES OF HYDRAS3 GRAPHICS • NO POWER, BATTERY HAS NOT “KICKED” IN • Data lost.
EXAMPLES OF HYDRAS3 GRAPHICS • NO POWER, BATTERY HAS NOT “KICKED” IN • Data lost. • Clock stopped data out of phase • RESET CLOCK IMMEDIATELY! • DATA WILL HAVE TO BE MOVED BACK INTO PHASE
EXAMPLES OF HYDRAS3 GRAPHICS • TO REST THE CLOCK • Select refresh • Select set date/time
EXAMPLES OF HYDRAS3 GRAPHICS • PREDICTIONS vs ACTUALS FOR DURBAN