Download
1 / 28
300 likes | 587 Vues
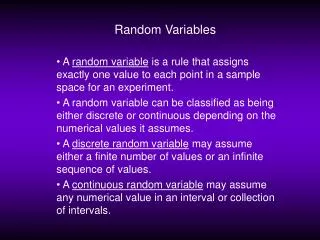
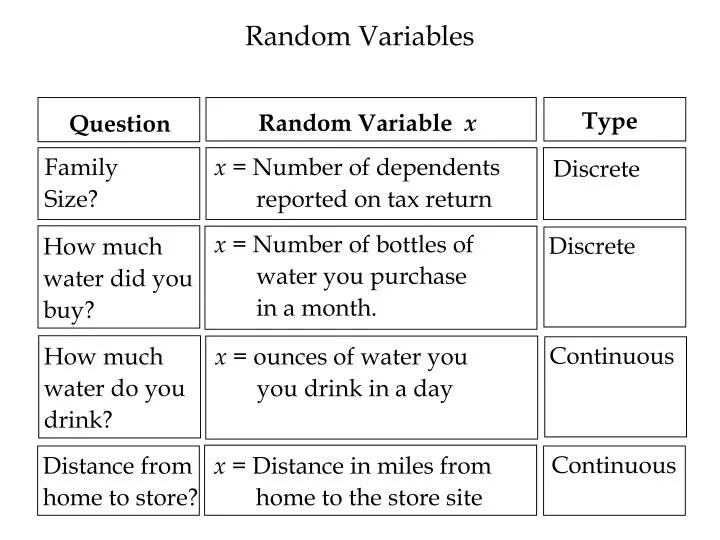
Random Variables. Type. Question. Random Variable x. Family Size?. x = Number of dependents reported on tax return. Discrete. Discrete. x = Number of bottles of water you purchase in a month. How much water did you buy?. Continuous.

E N D
Random Variables Type Question Random Variable x Family Size? x = Number of dependents reported on tax return Discrete Discrete x = Number of bottles of water you purchase in a month. How much water did you buy? Continuous x = ounces of water you you drink in a day How much water do you drink? Continuous x = Distance in miles from home to the store site Distance from home to store?
A Discrete Probability Distribution Example: JSL Appliances • Using past data on TV sales, a tabular representation of the probability distribution for TV sales was developed. Number Units Soldof Days 0 80 1 50 2 40 3 10 4 20 200 xf(x) 0 1 2 3 4 .40 .25 .20 .05 .10 1.00
A Discrete Probability Distribution Example: JSL Appliances E(x) = xf(x) xf(x)xf(x) 0 .40 1 .25 2 .20 3 .05 4 .10 E(x) = .00 .25 .40 .15 .40 1.20 expected number of TVs sold in a day: m = 1.20
A Discrete Probability Distribution Example: JSL Appliances Var(x) = (x - )2f(x) x (x – )2 f(x) (x – )2f(x) x – 0 1 2 3 4 .40 .25 .20 .05 .10 -1.2 1.44 .576 -0.2 0.04 .010 m = 1.20 TVs squared 0.8 0.64 .128 1.8 3.24 .162 2.8 7.84 .784 Variance of daily sales = s 2 = 1.660 Standard deviation of daily sales: s = 1.2884
Discrete Uniform Probability Distribution Example: Rolling a die Construct the probability distribution table for the rolling a die experiment. The random variable x could take on one of the following six values: 1, 2, 3, 4, 5, 6. What are the probabilities of these events, expected value, and variance? The probabilities of each of the outcomes are equal:
Discrete Uniform Probability Distribution Example: Rolling a die xf(x)xf(x) 1 .1667 2 .1667 3 .1667 4 .1667 5 .1667 6 .1667 E(x) = .1677 .3333 .5000 .6667 .8333 1.0000 3.5000 expected roll of the die =m = 3.5
Discrete Uniform Probability Distribution m = 3.5 Example: Rolling a die x (x – )2 f(x) (x – )2f(x) x – 1 2 3 4 5 6 -2.5 6.25 1.0417 .1667 .1667 .1667 .1667 .1667 .1667 -1.5 2.25 0.3750 -0.5 0.25 0.0417 0.5 0.25 0.0417 1.5 2.25 0.3750 2.5 6.25 1.0417 Variance of rolling a die = s 2 = 2.9167 Standard deviation of rolling a die: s = 1.7078
= (n + 1)/2 • 2 = (n2 - 1)/12 Discrete Uniform Probability Distribution If x starts at 1 and increases by 1, then Expected Value = 3.5 Variance = 2.9167 Standard Deviation = 1.7078
Poisson Probability Distribution Example: Mercy Hospital Patients arrive at the emergency room of Mercy Hospital at the average rate of 3 every 30 minutes on weekend evenings. m x What is the probability of 4 arrivals in 30 minutes on a weekend evening?
Poisson Probability Distribution Example: Mercy Hospital ≈ 3.0000 = 1.9147
Poisson Probability Distribution m = 3 Example: Mercy Hospital ≈ 3.0000 = 1.4376
Binomial Probability Distribution Four Properties of a Binomial Experiment • 1. The experiment consists of a sequence of n • identical trials. • 2. Two outcomes, success and failure, are possible • on each trial. 3. The probability of a success, denoted by p, does not change from trial to trial. 4. The trials are independent.
Binomial Probability Distribution Example: Evans Electronics Evans is concerned about a low retention rate for employees. In recent years, management has seen a turnover of 10% of the hourly employees annually. Thus, for any hourly employee chosen at random, management estimates a probability of 0.1 that the person will leave the company this year. p success n Choosing 3 hourly employees at random, what is the probability that 3 of them will leave the company this year? x success
Binomial Probability Distribution Example: Evans Electronics Evans is concerned about a low retention rate for employees. In recent years, management has seen a turnover of 10% of the hourly employees annually. Thus, for any hourly employee chosen at random, management estimates a probability of 0.1 that the person will leave the company this year. Choosing 3 hourly employees at random, what is the probability that 3 of them will leave the company this year?
Binomial Probability Distribution Example: Evans Electronics xf(x)xf(x) 0 .729 1 .243 2 .027 3 .001 E(x) = .000 .243 .054 .003 .300 expected number of employees that leave: m = 0.3
Binomial Probability Distribution Example: Evans Electronics m = 0.3 x (x – )2 f(x) (x – )2f(x) x – 0 1 2 3 .729 .243 .027 .001 -0.3 0.09 .0656 0.7 0.49 .1191 1.7 2.89 .0780 2.7 7.29 .0073 Variance = s 2 = .2700 Standard deviation s = 0.5196
= np • 2 = np(1 -p) Binomial Probability Distribution Expected Value = 3(.1) = .3 Variance = 3(.1)(1 – .1) = .27 Standard Deviation = .5196
Hypergeometric Probability Distribution For the binomial distribution: For theHypergeometric distribution: • 1. The experiment consists of a sequence of n • identical trials. • 2. Two outcomes, success and failure, are possible • on each trial. • The probability of a success does not change fromtrial to trial. • The probability of a success changes from trial to trial. 4. The trials are not independent. 4. The trials are independent.
number of ways n – x failures can be selected from a total of N – rfailures in the population • number of ways • xsuccesses can be selected • from a total of rsuccesses • in the population number of ways a sample of size n can be selected from a population of size N Hypergeometric Probability Distribution
Hypergeometric Probability Distribution Example: Neveready’s Batteries Bob has mistakenly dropped four bad batteries in a kitchen drawer that contains a bunch of miscellaneous tools, other junk, and six good batteries. The ten batteries that are now in the drawer are Neveready brand batteries. N – r failures successes r N n Bob randomly selects three for his cordless beard shaver. What is the probability he selects one good battery? x success
Hypergeometric Probability Distribution Example: Neveready’s Batteries where: x = 1 = number of good batteries in the sample n – x = 2 = number of bad batteries in the sample n = 3 = number of batteries in the sample r = 6 = number of good batteries in the population N – r = 4 = number of bad batteries in the population N = 10 = number of batteries in the population
Hypergeometric Probability Distribution Example: Neveready’s Batteries xf(x)xf(x) 0 .0333 1 .3000 2 .5000 3 .1667 E(x) = 0.0 0.3 1.0 0.5 1.8 expected number of good batteries in a sample of 3: m = 1.8
Hypergeometric Probability Distribution m = 1.8 Example: Neveready’s Batteries x (x – )2 f(x) (x – )2f(x) x – 0 1 2 3 .0333 .3000 .5000 .1667 -1.8 3.24 0.108 -0.8 0.64 0.192 0.2 0.04 0.020 1.2 1.44 0.240 Variance = s 2 = 0.560 Standard deviation s = 0.748
Hypergeometric Probability Distribution Example: Neveready’s Batteries Mean Variance
53 37 30 28 1 4 Hypergeometric Probability Distribution Example: Powerball www.musl.com/asx/createasx.asp?video=pb091010-high.asf x x x N = 59 x x P(1st 5) = ? P(PB) = 1/39 x You will “win” $20,000,000 if the winning numbers are and
1 4 28 30 53 37 Hypergeometric Probability Distribution Example: Powerball and N = 59 = number of ping pong balls in jar r = 5 = how many ping pong balls are needed to win n = 5 = number of ping pong balls selected x = 5 = number of ping pong balls need to win P(get 1st 5) = .0000001997
1 4 28 30 53 37 Hypergeometric Probability Distribution Example: Powerball P(PB) =1/39 and P(1st 5 ∩ PB) = P(1st 5) P(PB) = (.0000001997)(1/39) = .00000000512
E(x) = xf(x) Hypergeometric Probability Distribution $30,000,000 Example: Powerball with current Jackpot at $20,000,000 What are your expected winnings if you get the first 5 andthe Powerball correct? f ($19,999,999) = .00000000512 P(win) = .00000000512 f(-$1) = .99999999488 P(lose) = .99999999488 Sxf (x) = (-$1)(.99999999488) + ($19,999,999)(.00000000512) = -$0.90 Sxf (x) = (-$1)(.99999999488) + ($29,999,999)(.00000000512) = -$0.85