Download
1 / 37
380 likes | 608 Vues
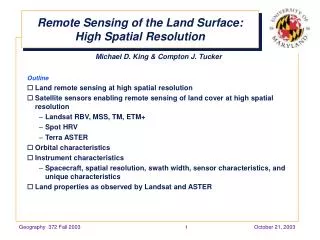
Remote Sensing of the Land Surface. May 2, 1996 North of Denver, CO . August 16, 1995 Central Brazil. What colors do we need to observe?. Ocean. Plants. Soils. Urban. Visible and Near Infrared Remote Sensing. Red : 610 - 700 nm Orange : 590 - 610 nm Yellow : 570 - 590 nm

E N D
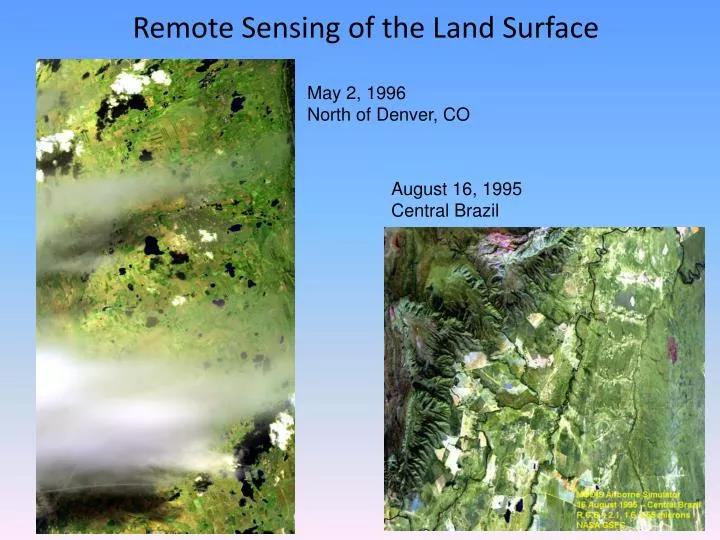
Remote Sensing of the Land Surface May 2, 1996 North of Denver, CO August 16, 1995 Central Brazil
What colors do we need to observe? Ocean Plants Soils Urban
Red: 610 - 700 nm Orange: 590 - 610 nm Yellow: 570 - 590 nm Green: 500 - 570 nm Blue: 450 - 500 nm Indigo: 430 - 450 nm Violet: 400 - 430 nm
Visible and Near IR Systems • Panchromatic imaging system: single channel detector sensitive to radiation within a broad wavelength range; if visible range, then the resulting image resembles a "black-and-white" photograph taken from space. The physical quantity being measured is the apparent brightness of the targets. The spectral information or "color" of the targets is lost. • IKONOSPAN ,SPOT ,HRV-PAN • Multispectral imaging system: multichannel detector with a few spectral bands. Each channel is sensitive to radiation within a narrow wavelength band. The resulting image is a multilayer image which contains both the brightness and spectral (color) information of the targets being observed. • LANDSAT MSS, LANDSAT TM , SPOT HRV-XS , IKONOSMS • Superspectral Imaging Systems: many more spectral channels (typically >10) than a multispectral sensor. The bands have narrower bandwidths, enabling the finer spectral characteristics of the targets to be captured by the sensor. • MODIS , MERIS • Hyperspectral Imaging Systems: "imaging spectrometer". it acquires images in about a hundred or more contiguous spectral bands. • Hyperion on EO1 satellite
Bands used for Land Surface Remote Sensing Table 1. Visible and IR bands used for Land Surface Studies *Application synthesis adapted from Yale University Remote Sensing and GIS Research Group
Photosynthetically Active Radiation PAR Action Spectrum violet - blue - green-yellow-orange - red - near IR
Strong Reflection Strong Differential Absorption
Attenuation in the Visible Wavelengths(molecular/no aerosol) ozone Blue and light blue Scattered by molecules 765 nm 865 nm Grant Petty, 2004
Blue and Light Blue Direct Beam Diffuse
Photosynthetically Active Radiation PAR Action Spectrum Blue Line: depiction of molecular scattering in the visible wavelength bands violet - blue - green-yellow-orange - red - near IR
Attenuation in the Visible Wavelengths Grant Petty, 2004
Aerosols scatter downwelling and upwelling visible radiation Haze Bloom?
Daytime Visibility Distant Dark Objects Appear Brighter “Clear” Day Hazy Day
Daytime Visibility consider scattering by aerosols White Sunlight Top of Atmosphere Color and Intensity Distance to the Dark Object
Daytime Visibility White Sunlight Top of Atmosphere Increased contribution of white light Object appears lighter with distance Longer Distance to the Dark Object
Daytime Visibility Distant Dark Objects Appear Brighter “Clear” Day Hazy Day
What the satellite sees White Sunlight Top of Atmosphere M molecular and aerosol scattering 400→ 500nm G A NIR atmosphere: windows in near IR plants 500-600 nm and near-IR ocean water 450-480 nm
Atmospheric Aerosol Correction Procedure Cloudy Ln (Optical Thickness) Aerosols Cloudless-Polluted Molecular Scattering Satellite Channels Molecules Blue Green Red Near-IR Aerosol Surface
NDVI • NDVI is calculated from the visible and near-infrared light reflected by vegetation. • Healthy vegetation • absorbs visible light and reflects a large portion of the near-IR light • Unhealthy or sparse vegetation • reflects more visible light and less near-IR light • Real vegetation is highly variable
NDVI NASA Earth Observatory (Illustration by Robert Simmon)
Satellite NDVI data sources NOAA 14 AVHRR MODIS NOAA 11 AVHRR NOAA 9 AVHRR SPOT NOAA 7 AVHRR 1980 1985 1990 1995 2000 2005 2010 SeaWiFS NOAA-16 NPP NOAA-18 NOAA 9 NOAA-17 C. Tucker
Terra Satellite • December 1999: Terra spacecraft • Moderate-resolution Imaging Spectroradiometer, or MODIS, that greatly improves scientists’ ability to measure plant growth on a global scale. • MODIS: higher spatial resolution (up to 250-meter resolution) than AVHRR
Average NDVI 1981-2006 ~40,000 images composited Green NDVI 1 C. Tucker
Beltsville USA winter wheat biomass C. Tucker
Remote Sensing of Soil Moisture Lecture 7
What is soil moisture? • Soil moisture water that is held in the spaces between soil particles. • Surface soil moisture is the water that is in the upper 10 cm of soil • Root zone soil moistureis the water that is available to plants, which is generally considered to be in the upper 200 cm of soil. • Ratio of liquid water content to the soil in percentage of volume or weight hysteresis: memory of previous precipitation events. • Soil moisture is a key variable used to describe water and energy exchanges at the land surface/atmosphere interface
Remote Sensing of Soil Moisture • Thermal infrared techniques • Microwave • Active • Passive • Optical (visible/near infrared)
Advantages of Microwave RS • Transparent atmosphere • Vegetation semitransparent • Microwave measurement strongly dependent on dielectric properties of soil water • Not dependent on solar illumination
Basis for Microwave Remote Sensing of Soil Moisture • Basis for microwave remote sensing of soil moisture is contrast in dielectric constant of water (80) and dry soil (<5), causing emissivity contrast of 0.4 for water and 0.95 for dry land (Schmugge 2002) • Research concludes surface layer sm can be determined to about ¼ wavelength, i.e. 0-5 cm layer using microwave λ = 21 cm • Longer λ better for increased depth, less noise
Soil moisture • Soil moisture in pasture • λ = 21 cm responded λ = 21 cm Schmugge 2002
Emissivity and Soil Moisture • Brightness temperature related to emissivity for 0 to 5 cm surface layer • εM is soil surface emissivity,TM is soil surface temperature • (1-εM)Tsky is ~ 2K, therefore εM ~ TB/TM • If TM estimated independently, εM can be determined • Typical range for εM is 0.9 for dry soil to 0.6 for smooth wet soil TB = εMTM + (1-εM)Tsky Schmugge 2002
Factors affecting accuracy • Vegetation cover • Most important, dense vegetation (corn, forest) can obscure soil surface • Greater effect at shorter λ • Soil properties • Density and texture • Surface roughness • Commonly 10 to 20% reduction in response range • Density and roughness relatively constant
Radar Remote Sensing— Soil Moisture RadarPol: VV, HH & HV Res – 3 and 10 km Radiometer Pol: H, V Res =40 km, dT= 0.64º K SGP’97 Courtesy: Tom Jackson, USDA • HYDROS (http://www.skyrocket.de/space/doc_sdat/hydros.htm) • Back-up ESSP mission for global soil moisture. • L-band radiometer. • L-band radar. • Died mission