Download
1 / 1
10 likes | 107 Vues
Schematic Diagram of SLM. I B. LOCK-IN AMPLIFIER. CURRENT SOURCE. COMPUTER. V. OPTICAL FIBER. LASER. FOCUSING OPTIC. XYZ STAGE. SAMPLE STAGE. MECHANICAL CHOPPER. MICROSCOPE OBJECTIVE. G. F.

E N D
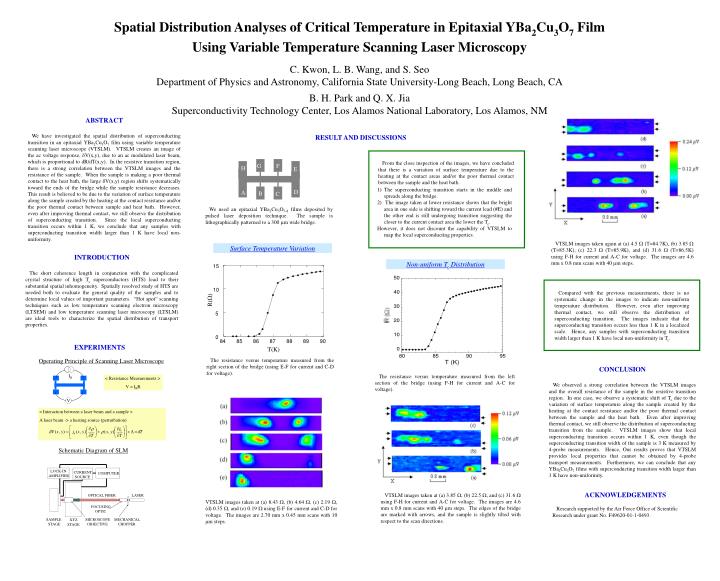
Schematic Diagram of SLM IB LOCK-IN AMPLIFIER CURRENT SOURCE COMPUTER V OPTICAL FIBER LASER FOCUSING OPTIC XYZ STAGE SAMPLE STAGE MECHANICAL CHOPPER MICROSCOPE OBJECTIVE G F From the close inspection of the images, we have concluded that there is a variation of surface temperature due to the heating at the contact areas and/or the poor thermal contact between the sample and the heat bath. 15 H E R(W) 10 D • The superconducting transition starts in the middle and spreads along the bridge. • The image taken at lower resistance shows that the bright area in one side is shifting toward the current lead (#E) and the other end is still undergoing transition suggesting the closer to the current contact area the lower the Tc. • However, it does not discount the capability of VTSLM to map the local superconducting properties. A B C 5 We used an epitaxial YBa2Cu3O7-d films deposited by pulsed laser deposition technique. The sample is lithographically patterned to a 300 mm wide bridge. 0 84 85 86 87 88 89 90 T(K) The resistance versus temperature measured from the right section of the bridge (using E-F for current and C-D for voltage). Compared with the previous measurements, there is no systematic change in the images to indicate non-uniform temperature distribution. However, even after improving thermal contact, we still observe the distribution of superconducting transition. The images indicate that the superconducting transition occurs less than 1 K in a localized scale. Hence, any samples with superconducting transition width larger than 1 K have local non-uniformity in Tc. VTSLM images taken again at (a) 4.5 (T=84.7K), (b) 3.85 (T=85.3K), (c) 22.3 (T=85.9K), and (d) 31.6 (T=86.5K) using F-H for current and A-C for voltage. The images are 4.6 mm x 0.8 mm scans with 40 mm steps. Operating Principle of Scanning Laser Microscope < Resistance Measurements > V = IBR The resistance versus temperature measured from the left section of the bridge (using F-H for current and A-C for voltage). < Interaction between a laser beam and a sample > A laser beam -> a heating source (perturbation) VTSLM images taken at (a) 3.85 , (b) 22.5 , and (c) 31.6 using F-H for current and A-C for voltage. The images are 4.6 mm x 0.8 mm scans with 40 mm steps. The edges of the bridge are marked with arrows, and the sample is slightly tilted with respect to the scan directions. VTSLM images taken at (a) 8.43 , (b) 4.64 , (c) 2.19 , (d) 0.35 , and (e) 0.19 using E-F for current and C-D for voltage. The images are 2.70 mm x 0.45 mm scans with 10 mm steps. Spatial Distribution Analyses of Critical Temperature in Epitaxial YBa2Cu3O7 Film Using Variable Temperature Scanning Laser Microscopy C. Kwon, L. B. Wang, and S. Seo Department of Physics and Astronomy, California State University-Long Beach, Long Beach, CA B. H. Park and Q. X. Jia Superconductivity Technology Center, Los Alamos National Laboratory, Los Alamos, NM ABSTRACT We have investigated the spatial distribution of superconducting transition in an epitaxial YBa2Cu3O7 film using variable temperature scanning laser microscope (VTSLM). VTSLM creates an image of the ac voltage response, V(x,y), due to an ac modulated laser beam, which is proportional to dR/dT(x,y). In the resistive transition region, there is a strong correlation between the VTSLM images and the resistance of the sample. When the sample is making a poor thermal contact to the heat bath, the large V(x,y) region shifts systematically toward the ends of the bridge while the sample resistance decreases. This result is believed to be due to the variation of surface temperature along the sample created by the heating at the contact resistance and/or the poor thermal contact between sample and heat bath. However, even after improving thermal contact, we still observe the distribution of superconducting transition. Since the local superconducting transition occurs within 1 K, we conclude that any samples with superconducting transition width larger than 1 K have local non-uniformity. RESULT AND DISCUSSIONS Surface Temperature Variation INTRODUCTION The short coherence length in conjunction with the complicated crystal structure of high Tc superconductors (HTS) lead to their substantial spatial inhomogeneity. Spatially resolved study of HTS are needed both to evaluate the general quality of the samples and to determine local values of important parameters. “Hot spot” scanning techniques such as low temperature scanning electron microscopy (LTSEM) and low temperature scanning laser microscopy (LTSLM) are ideal tools to characterize the spatial distribution of transport properties. Non-uniform Tc Distribution EXPERIMENTS CONCLUSION We observed a strong correlation between the VTSLM images and the overall resistance of the sample in the resistive transition region. In one case, we observe a systematic shift of Tc due to the variation of surface temperature along the sample created by the heating at the contact resistance and/or the poor thermal contact between the sample and the heat bath. Even after improving thermal contact, we still observe the distribution of superconducting transition from the sample. VTSLM images show that local superconducting transition occurs within 1 K, even though the superconducting transition width of the sample is 3 K measured by 4-probe measurements. Hence, Our results proves that VTSLM provides local properties that cannot be obtained by 4-probe transport measurements. Furthermore, we can conclude that any YBa2Cu3O7 films with superconducting transition width larger than 1 K have non-uniformity. ACKNOWLEDGEMENTS Research supported by the Air Force Office of Scientific Research under grant No. F49620-01-1-0493.


