Download
1 / 27
270 likes | 436 Vues
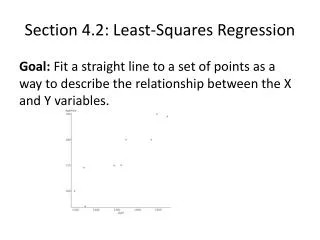
Introduction to Regression Lecture 4.2. Indicator variables for estimating seasonal effects in time series another application, Meter Sales analysis Correlated explanatory variables. Housing Completions case study. Table 1.7 Completions and Quarterly Indicators. Model formulation.

E N D
Introduction to RegressionLecture 4.2 • Indicator variables for estimating seasonal effects in time series • another application, Meter Sales analysis • Correlated explanatory variables Diploma in Statistics Introduction to Regression
Housing Completions case study Diploma in Statistics Introduction to Regression
Table 1.7 Completions and Quarterly Indicators Diploma in Statistics Introduction to Regression
Model formulation Completions = a1Q1 + a2Q2 + a3Q3 + a4Q4 + b Time + e. Quarter 1: Completions = a1 + b Time Quarter 2: Completions = a2 + b Time, Homework 4.1.1: Write down the prediction formulas for future third and fourth quarters. Diploma in Statistics Introduction to Regression
Prediction formula Predicted completions = 3,248 Q1 + 3901 Q2 + 4174 Q3 + 5031 Q4 + 250 Time 500 Exercise: Write down separate prediction formulas for each of the four quarters. Make predictions for each quarter of 2001 and of 2002. Diploma in Statistics Introduction to Regression
A sales forecasting problem Southern Oil Products • vegetable oil producer • raw material supply is seasonal, variety of sources / countries • problems in second quarter of last year prompts business review • forecasts required for • budgetting and staff planning • quantifying extent of last year's problem Diploma in Statistics Introduction to Regression
Table 9.1 Quarterly production of vegetable oil, in numbers of 50 litre drums, for a six year period Diploma in Statistics Introduction to Regression
Initial data analysis Diploma in Statistics Introduction to Regression
A simple linear model for trend (Years 1-5) Regression Analysis: Production versus Time The regression equation is Production = 1177 + 36.2 Time Exercise: Estimate quarterly/annual growth in production Predictor Coef SE Coef T P Constant 1176.61 53.61 21.95 0.000 Time 36.223 4.475 8.09 0.000 Exercise: Calculate a confidence interval for quarterly/annual growth in production S = 115.405 Exercise: Comment on prediction Diploma in Statistics Introduction to Regression
Quarterly indicator variables Special variables Q1, Q2, Q3 and Q4 called indicator variables may be added to the simple regression model to produce a multiple regression model incorporating the seasonal effects. Each quarterly indicator takes the value 1 in the relevant quarter and 0 otherwise. Note that, in each row, only one of the quarterly indicators takes the value 1, while the other three take the value 0. Thus, for each time (row), the indicator with value 1 indicates the corresponding quarter, 1, 2, 3 or 4 Diploma in Statistics Introduction to Regression
Table 9.2 Quarterly production of vegetable oil, in numbers of 50 litre drums, with Time and quarterly indicators, for a five year period Diploma in Statistics Introduction to Regression
Multiple regression model Production = a1Q1 + a2Q2 + a3Q3 + a4Q4 + b Time + e. Diploma in Statistics Introduction to Regression
Regression AnalysisProduction vs Q1, Q2, Q3, Q4, Time The regression equation is Production = 1030 Q1 +1292 Q2 + 1210 Q3 + 1279 Q4 + 33.7 Time Predictor Coef SE Coef T P Noconstant Q1 1029.87 23.41 43.99 0.000 Q2 1292.35 24.45 52.85 0.000 Q3 1210.42 25.55 47.37 0.000 Q4 1278.70 26.71 47.88 0.000 Time 33.725 1.619 20.83 0.000 S = 40.9654 Diploma in Statistics Introduction to Regression
Exercise Predict the first quarter production levels for Year 6 and Year 7 Comment on prediction error with respect to (i) its previous vale (ii) recent production levels Next: Diagnostic analysis Diploma in Statistics Introduction to Regression
Exercise Following calculation of a revised regression, make a table of initial and revised coefficient estimates and residual standard deviations. Compare. Which would you choose? Why? Diploma in Statistics Introduction to Regression
Exercise Confirm and quantify the extent of the problem in Year 6, Q2. Homework 4.2.2 Confirm and quantify the extent of the recovery in Year 6, Q3. Diploma in Statistics Introduction to Regression
Multiple regression model,alternative formulation Production = a + b1Q1 + b2Q2 + b3Q3 + bTime Time + e. Diploma in Statistics Introduction to Regression
Alternative regression * Q4 is highly correlated with other X variables * Q4 has been removed from the equation. The regression equation is Production = 1279 - 249 Q1 + 13.7 Q2 - 68.3 Q3 + 33.7 Time Predictor Coef SE Coef T P Constant 1278.70 26.71 47.88 0.000 Q1 -248.82 26.36 -9.44 0.000 Q2 13.65 26.11 0.52 0.609 Q3 -68.27 25.96 -2.63 0.019 Time 33.725 1.619 20.83 0.000 S = 40.9654 Diploma in Statistics Introduction to Regression
Homework 4.2.3 List correspondences between the output from the original regression and the output from the alternative regression. Confirm that the coefficients of Q1, Q2 and Q3 in the original are the corresponding coefficients in the alternative with the Q4 coefficient added. Diploma in Statistics Introduction to Regression
Introduction to RegressionLecture 4.2 • Indicator variables for estimating seasonal effects in time series • another application, Meter Sales analysis • Correlated explanatory variables Diploma in Statistics Introduction to Regression
Another application, meter sales analysis Recall the analysis of Meter sales, discussed in Lab 1 Feedback.doc. Diploma in Statistics Introduction to Regression
Another application, Meter Sales analysis Meter Sales jumped when nominal Phone Charge increased. Model these jumps by adding "indicators" defined to be 0 for all years prior to the jump and 1 for all years during and after the jump. Thus, the first jump occurred during 1952, so the corresponding indicator will be 0 from 1949 to 1952 and 1 from 1953 to 1983. Multiplying this explanatory variable by regression coefficient b adds 0 to predicted Meter Sales from 1949 to 1952 and adds b from 1953 to 1983. Diploma in Statistics Introduction to Regression
Another application, Meter Sales analysis Regression Analysis: Meter Sales versus GNP, RLP, ... Predictor Coef SE Coef T P Constant 38.87 51.62 0.75 0.461 GNP 0.15905 0.04881 3.26 0.004 RLP -73.53 14.76 -4.98 0.000 RPC -14.36 65.76 -0.22 0.830 Jump1953 13.385 9.688 1.38 0.184 Jump1956 23.110 8.140 2.84 0.011 Jump1964 41.93 15.17 2.76 0.013 Jump1970 16.39 10.19 1.61 0.125 S = 5.42373 Diploma in Statistics Introduction to Regression
Another application, Meter Sales analysis Note that the t-value for RPC is negligible so that RPC may be omitted. The variation explained by RPC is captured by the four indicator variables. Also, the s value is lower than before, suggesting that the variation in Meter Sales is better explained by the indicators than by RPC alone. N.B. Additional uses for indicators may be found in Extra Notes, Indicators.doc Diploma in Statistics Introduction to Regression
Introduction to RegressionLecture 4.2 • Indicator variables for estimating seasonal effects in time series • another application, Meter Sales analysis • Correlated explanatory variables Diploma in Statistics Introduction to Regression
Correlated explanatory variables Ref: Extra Notes Homework 4.2.4 Calculate the simple linear regressions of Jobtime on each of T_Ops and Units. Confirm the corresponding t-values. Calculate the simple linear regression of Jobtime on Ops per Unit. Comment of the negative correlation of Jobtime with Ops per Unit in the light of the corresponding t-value. Confirm the calculation of the R2 values. Diploma in Statistics Introduction to Regression
Reading SA §§ 9.1- 9.2 Hamilton, pp 82-84, 133-136 Diploma in Statistics Introduction to Regression