Download

1 / 17
180 likes | 315 Vues
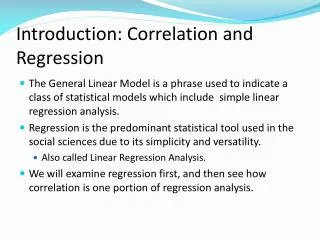
4.2 Introduction to Correlation. Objective: By the end of this section, I will be able to… Calculate and interpret the value of the correlation coefficient. Correlation Equation. CORRELATION COEFFICIENT. Measures the strength and direction of a relationship between two variables

E N D
4.2 Introduction to Correlation Objective: By the end of this section, I will be able to… • Calculate and interpret the value of the correlation coefficient.
CORRELATION COEFFICIENT • Measures the strengthand directionof a relationship between two variables • Is denoted by the letter r • The range is from -1 to +1
EXAMPLES STRONG + Slightly strong + • r = + 1 • r = + 0.75 • r = + 0.5 • r = +0.25 • r = 0 • r = - 0.25 • r = - 0.5 • r = - 0.75 • r = - 1 Moderate + Weak + No Association Weak - Moderate - Slightly Strong - STRONG -
EXAMPLES Weak Positive Association Slightly Strong Positive Association Strong Positive Association • r = + 1 • r = + 0.7 • r = - 0.5 • r = 0 • r = + 0.3 • r = - 1 Strong Negative Association Moderate Negative Association No Association
4.3 Introduction to Regression Objectives: By the end of this section, I will be able to… • Calculate the value and understand the meaning of the slope and the y intercept of the regression line. • Predict values of y for given values of x.
Algebra Days Remember the formula: y = mx + b y and x are the variables m is the slope of the line bis the y-intercept
Algebra Days Then – linear equation NOW – linear regression
NEW SYMBOLS y and x are the variables m = b1 is the slope b = bo = ais the y-intercept
Using data to predict the future Once we have graphed the data and determined the association, we can fit a regression line which best fits or models the data. Line of Best Fit
http://www.keymath.com/documents/sia2/CalculatorNotes_Ch03_SIA2.pdfhttp://www.keymath.com/documents/sia2/CalculatorNotes_Ch03_SIA2.pdf Select DiagnosticOn from Catalog to get r2 and r values with LinReg. For LinReg ALWAYS use Choice #8 NOT #4.
LINE OF BEST FIT REGRESSION LINE
Regression Lines The Regression Line is sensitive to Outliers.
Example In BMX dirt-bike racing, jumping high or “getting air” depends on many factors: the rider’s skill, the angle of the jump, and the weight of the bike. Here are data about the maximum height for various bike weights.