Download
1 / 17
190 likes | 233 Vues
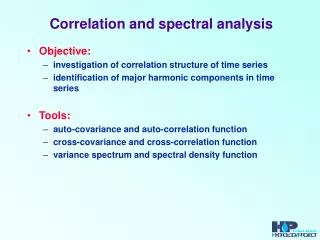
Introduction to Correlation Analysis. Objectives. Correlation Types of Correlation Karl Pearson’s coefficient of correlation Correlation in case of bivariate frequency distribution Coefficient of determination Spearman’s Rank Correlation coefficient. Correlation.

E N D
Objectives • Correlation • Types of Correlation • Karl Pearson’s coefficient of correlation • Correlation in case of bivariate frequency distribution • Coefficient of determination • Spearman’s Rank Correlation coefficient
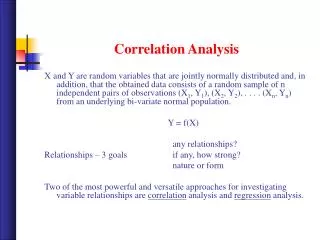
Correlation • The concept of measuring the degree of association between the variables is called correlation analysis. • Correlation analysis deals with the association between two or more variables • Eg. Price & demand, amount of rainfall and yield of rice, height & weight of an individual.
Methods • Scatter Diagram • Karl Pearson’s coefficient of correlation • Rank Correlation
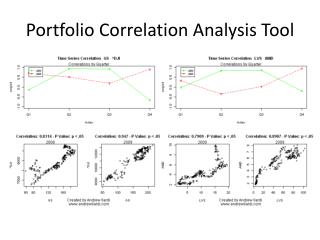
Scatter Plots and Correlation • A scatter plot (or scatter diagram) is used to show the relationship between two variables • Correlation analysis is used to measure strength of the association (linear relationship) between two variables • Only concerned with strength of the relationship • No causal effect is implied
Scatter Plot Examples Linear relationships Curvilinear relationships y y x x y y x x
Scatter Plot Examples (continued) Strong relationships Weak relationships y y x x y y x x
Scatter Plot Examples (continued) No relationship y x y x
Correlation Coefficient (continued) • The correlation coefficient r is used to measure the strength of the linear relationship in the observations • Unit free • Range between -1 and 1 • The closer to -1, the stronger the negative linear relationship • The closer to 1, the stronger the positive linear relationship • The closer to 0, the weaker the linear relationship
Examples of Approximate r Values y y y x x x r = -1 r = -.6 r = 0 y y x x r = +.3 r = +1
Calculating the Correlation Coefficient Actual Mean Method or the algebraic equivalent: where: r = Sample correlation coefficient n = Sample size x = Value of the independent variable y = Value of the dependent variable
Calculation Example (continued) Tree Height, y r = 0.886 → relatively strong positive linear association between x and y Trunk Diameter, x
Excel Output Excel Correlation Output Tools / data analysis / correlation… Correlation between Tree Height and Trunk Diameter
Actual Mean Method Direct Method Assumed Mean Method Bivariate frequency table
D= difference of rank between the paired items in two series N= No. of paired items in the two series m= No. of items whose ranks are common