Download
1 / 11
490 likes | 1.22k Vues
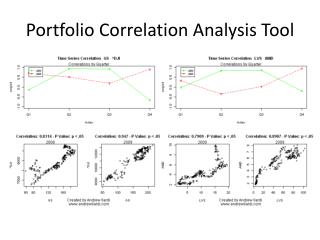
Correlation Analysis. 5th - 9th December 2011, Rome. Now what if we would like to measure how well two variables are associated with one another?. Correlations. What is a correlation?. A statistical correlation is a dependent relationship between two variables

E N D
Correlation Analysis 5th - 9th December 2011, Rome
Now what if we would like to measure how well two variables are associated with one another? Correlations
What is a correlation? • A statistical correlation is a dependent relationship between two variables • Examples include the relationship between: • Height and weight • Level of education and income • Price and demand of rice • Humidity and precipitation • However, a correlation is not the same as causality
Tests • Pearson correlation coefficients (r) are the test statistics used to measure strength of the linear** relationship between two variables • A correlation also does not have to be a linear relationship in this case we use a different test (Spearman's rho)
Strong negative correlation No correlation Strong positive correlation Types of correlations • Positive correlations: Two variables are positively correlated if increases (or decreases) in one variable results in increases (or decreases) in the other variable. • Negative correlations: Two variables are negatively correlated if one increases (or decreases) and the other decreases (on increases). • No correlations: Two variables are not correlated if there is no linear relationship between them. -1--------------------------0---------------------------1
Illustrating types of correlations Perfect positive correlation Test statistic= 1 Positive correlation Test statistics>0 and <1 Perfect negative correlation Test statistic= -1 Negative correlation Test statistic<0 and >-1
Example for the Kenya Data Correlation between children’s weight and height… Is this a positive or negative correlation??
To calculate a Pearson’s correlation coefficient in SPSS In SPSS, correlations are run using the following steps: • Click on “Analyze” drop down menu • Click on “Correlate” • Click on “Bivariate…” • Move the variables that you are interested in assessing the correlation between into the box on the right • Click “OK”
example in SPSS… Using SPSS we get Pearson’s correlation (0.932)
Lets refresh briefly, what does a correlation of 0.932 mean?? • What does *** mean?
Summary Check out pg 171 of CFSVA manual for an overview of the test