Download
1 / 54
650 likes | 1.02k Vues
Canonical Correlation Analysis. Shyh-Kang Jeng Department of Electrical Engineering/ Graduate Institute of Communication/ Graduate Institute of Networking and Multimedia. Canonical Correlation Analysis. Seeks to identify and quantify the association between two sets of variables Examples

E N D
Canonical Correlation Analysis Shyh-Kang Jeng Department of Electrical Engineering/ Graduate Institute of Communication/ Graduate Institute of Networking and Multimedia
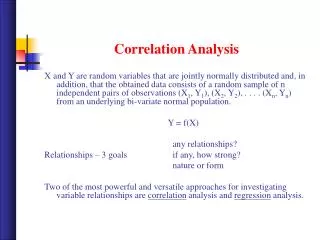
Canonical Correlation Analysis • Seeks to identify and quantify the association between two sets of variables • Examples • Relating arithmetic speed and arithmetic power to reading speed and reading power • Relating government policy variables with economic goal variables • Relating college “performance” variables with precollege “achievement” variables
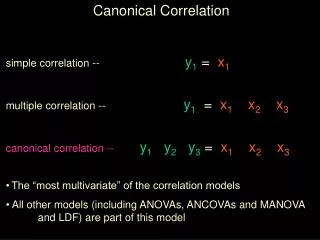
Canonical Correlation Analysis • Focuses on the correlation between a linear combination of the variables in one set and a linear combination of the variables in another set • First to determine the pair of linear combinations having the largest correlation • Next to determine the pair of linear combinations having the largest correlation among all pairs uncorrelated with the initially selected pair, and so on
Canonical Correlation Analysis • Canonical variables • Pairs of linear combinations used in canonical correlation analysis • Canonical correlations • Correlations between the canonical variables • Measures the strength of association between the two sets of variables • Maximization aspect • Attempt to concentrate a high-dimensional relationship between two sets of variables into a few pairs of canonical variables
Canonical Variables and Canonical Correlations • Covariances between pairs of variables from different sets are contained in S12 or, equivalently S21 • When p and q are relatively large, interpreting the elements of S12 collectively is very difficult • Canonical correlation analysis can summarize the associations between two sets in terms of a few carefully chosen covariances rather than the pq covariances in S12
Canonical Variables and Canonical Correlations • First pair of canonical variables • Pair of linear combinations U1, V1 having unit variances, which maximize the correlation • kth pair of canonical variables • Pair of linear combinations Uk, Vk having unit variances having unit variances, which maximize the correlation among all choices uncorrelated with the previous k-1 canonical variable pairs
Example 10.5: Sample Correlation Matrix Based on 784 Responses
Example 10.5: Sample Correlations between Original and Canonical Variables
Sample Correlation Matrices between Canonical and Component Variables
Proportion of Sample Variances Explained by the Canonical Variables
Proportion of Sample Variances Explained by the Canonical Variables