Download
1 / 8
120 likes | 245 Vues
Correlation Analysis. X and Y are random variables that are jointly normally distributed and, in addition, that the obtained data consists of a random sample of n independent pairs of observations (X 1 , Y 1 ), (X 2 , Y 2 ), . . . . (X n , Y n ) from an underlying bi-variate normal population.

E N D
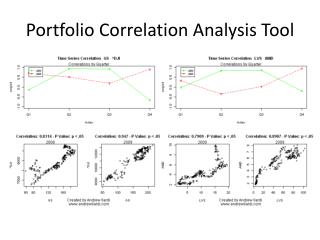
Correlation Analysis X and Y are random variables that are jointly normally distributed and, in addition, that the obtained data consists of a random sample of n independent pairs of observations (X1, Y1), (X2, Y2), . . . . (Xn, Yn) from an underlying bi-variate normal population. Y = f(X) any relationships? Relationships – 3 goals if any, how strong? nature or form Two of the most powerful and versatile approaches for investigating variable relationships are correlation analysis and regression analysis.
Correlation Analysis • Measures the strength of the relationship between two or more variables • Correlation • Measures the degree to which there is an association between two internally scaled variables
Regression Analysis • Used to understand the nature of the relationship between two or more variables • A dependent or response variable (Y) is related to one or more independent or predictor variables (Xs) • Object is to build a regression model relating dependent variable to one or more independent variables • Model can be used to describe, predict, and control variable of interest on the basis of independent variables
Simple Linear Regression Yi = βo + β1 xi + εi Where • Y • Dependent variable • X • Independent variable • βo • Model parameter • Mean value of dependent variable (Y) when the independent variable (X) is zero
Simple Linear Regression (Contd.) • β1 • Model parameter • Slope that measures change in mean value of dependent variable associated with a one-unit increase in the independent variable • εi • Error term that describes the effects on Yi of all factors other than value of Xi
Estimating the Model Parameters • Calculate point estimate bo and b1 of unknown parameter βo and β1 • Obtain random sample and use this information from sample to estimate βo and β1 • Obtain a line of best "fit" for sample data points - least squares line Yi = bo + b1 xi
Multiple Linear Regression • A linear combination of predictor factors is used to predict the outcome or response factors • Involves computation of a multiple linear regression equation • More than one independent variable is included in a single linear regression model