Download
1 / 28
320 likes | 638 Vues
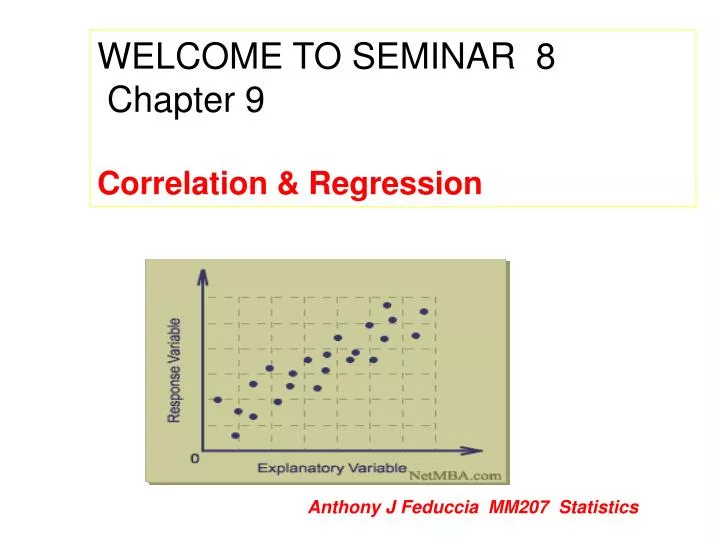
Example Scatterplot. WELCOME TO SEMINAR 8 Chapter 9 Correlation & Regression. Anthony J Feduccia MM207 Statistics. Chapter Outline. 9.1 Correlation 9.2 Linear Regression Skip 9.3 and 9.4. Correlation. Correlation A relationship between two variables.

E N D
Example Scatterplot WELCOME TO SEMINAR 8 Chapter 9 Correlation & Regression Anthony J Feduccia MM207 Statistics
Chapter Outline • 9.1 Correlation • 9.2 Linear Regression • Skip 9.3 and 9.4 Larson/Farber 4th ed.
Correlation Correlation • A relationship between two variables. • The data can be represented by ordered pairs (x, y) • x is theindependent(orexplanatory)variable • y is thedependent(orresponse)variable Larson/Farber 4th ed.
Example: Constructing a Scatter Plot Page 497 Example 1 A marketing manager conducted a study to determine whether there is a linear relationship between money spent on advertising and company sales. The data are shown in the table. Display the data in a scatter plot and determine whether there appears to be a positive or negative linear correlation or no linear correlation. Larson/Farber 4th ed.
Solution: Constructing a Scatter Plot y Company sales (in thousands of dollars) x Advertising expenses (in thousands of dollars) Appears to be a positive linear correlation. As the advertising expenses increase, the sales tend to increase.
Correlation Coefficient Correlation coefficient • A measure of the strength and the direction of a linear relationship between two variables. • The symbol r represents the sample correlation coefficient. • A formula for r is • The population correlation coefficient is represented by ρ (rho). n is the number of data pairs Larson/Farber 4th ed.
1 -1 0 Correlation Coefficient • The range of the correlation coefficient is -1 to 1. If r = -1 there is a perfect negative correlation If r is close to 0 there is no linear correlation If r = 1 there is a perfect positive correlation Larson/Farber 4th ed.
y y y y x x x x Linear Correlation r = 0.91 r = 0.88 Strong negative correlation Strong positive correlation r = 0.42 r = 0.07 Weak positive correlation Nonlinear Correlation Larson/Farber 4th ed.
Regression lines • After verifying that the linear correlation between two variables is significant, next we determine the equation of the line that best models the data (regression line). • Can be used to predict the value of y for a given value of x. y x Larson/Farber 4th ed.
Regression Line Regression line(line of best fit) • The line for which the sum of the squares of the residuals is a minimum. • The equation of a regression line for an independent variable x and a dependent variable y is ŷ = mx + b y-intercept Predicted y-value for a given x-value Slope
The Equation of a Regression Line • ŷ = mx + b where • is the mean of the y-values in the data • is the mean of the x-values in the data • The regression line always passes through the point Larson/Farber 4th ed.
Correlation Coefficient Example: The following data represents the number of hours 12 different students watched television during the weekend and the scores of each student who took a test the following Monday. a.) Display the scatter plot. b.) Calculate the correlation coefficient r. Continued.
y 100 80 60 Test score 40 20 x 2 4 6 8 10 Hours watching TV Correlation Coefficient Using Excel Go to Course Extras for Excel Template Use Excel. Insert> Chart>Scatter Diagram
Correlation Coefficient The formula method: There is a strong negative linear correlation (-0.831). As the number of hours spent watching TV increases, the test scores tend to decrease.
Testing a Population Correlation Coefficient Example: The following data represents the number of hours 12 different students watched television during the weekend and the scores of each student who took a test the following Monday. The correlation coefficient r0.831. Is the correlation coefficient significant at = 0.01? Continued.
Hypothesis Testing for ρ The t-Test for the Correlation Coefficient A t-test can be used to test whether the correlation between two variables is significant. The test statistic is r and the standardized test statistic follows a t-distribution with n – 2 degrees of freedom. In this text, only two-tailed hypothesis tests for ρ are considered.
0 t t0 = 3.169 t0 = 3.169 Hypothesis Testing for ρ Example continued: H0: ρ = 0 (no correlation) Ha: ρ 0 (significant correlation) The level of significance is = 0.01. Degrees of freedom are d.f. = 12 – 2 = 10. The critical values are t0 = 3.169 and t0 = 3.169. The standardized test statistic is The test statistic falls in the rejection region, so H0 is rejected. At the 1% level of significance, there is enough evidence to conclude that there is a significant linear correlation between the number of hours of TV watched over the weekend and the test scores on Monday morning.
Correlation and Causation The fact that two variables are strongly correlated does not in itself imply a cause-and-effect relationship between the variables. If there is a significant correlation between two variables, you should consider the following possibilities. • Is there a direct cause-and-effect relationship between the variables? • Does x cause y? • Is there a reverse cause-and-effect relationship between the variables? • Does y cause x? • Is it possible that the relationship between the variables can be caused by a third variable or by a combination of several other variables? • Is it possible that the relationship between two variables may be a coincidence?
Regression Line Example: The following data represents the number of hours 12 different students watched television during the weekend and the scores of each student who took a test the following Monday. a.) Find the equation of the regression line. b.) Use the equation to find the expected test score for a student who watches 9 hours of TV.
y 100 80 60 Test score 40 20 x 2 4 6 8 10 Hours watching TV Regression Line Example continued: ŷ = –4.07x + 93.97 Use Excel instead. See Course Extras Continued.