Download
1 / 14
140 likes | 145 Vues
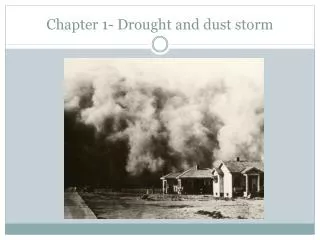
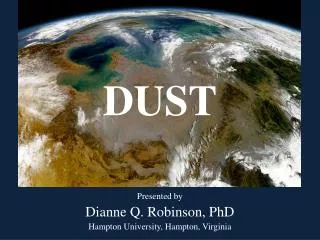
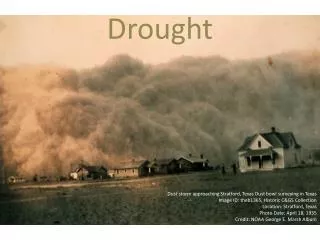
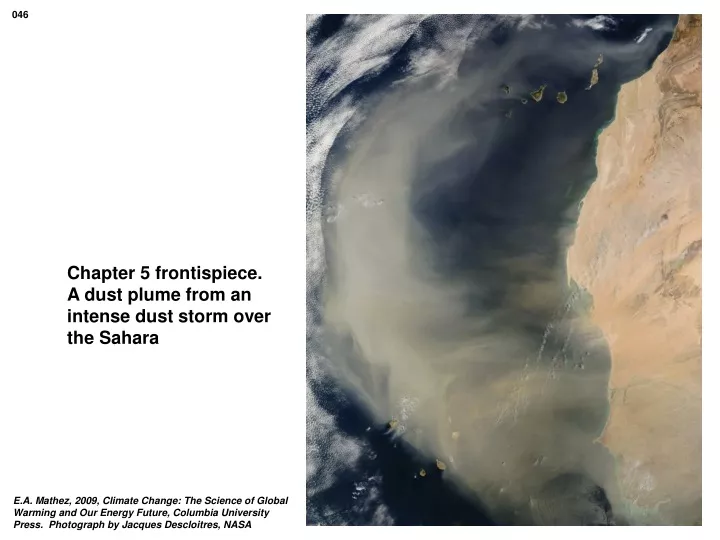
046. Chapter 5 frontispiece. A dust plume from an intense dust storm over the Sahara. E.A. Mathez, 2009, Climate Change: The Science of Global Warming and Our Energy Future, Columbia University Press. Photograph by Jacques Descloitres, NASA. 047. Figure 5.1. The spring Sun in the Arctic.

E N D
046 Chapter 5 frontispiece. A dust plume from an intense dust storm over the Sahara E.A. Mathez, 2009, Climate Change: The Science of Global Warming and Our Energy Future, Columbia University Press. Photograph by Jacques Descloitres, NASA
047 Figure 5.1. The spring Sun in the Arctic E.A. Mathez, 2009, Climate Change: The Science of Global Warming and Our Energy Future, Columbia University Press. Photograph by Rear Admiral H.D. Nygren, NOAA
048 Figure 5.2. Variations in total annual and solstice insolations with latitude E.A. Mathez, 2009, Climate Change: The Science of Global Warming and Our Energy Future, Columbia University Press. Source: Hartmann, 1994
049 Figure 5.3. The flow of energy from the Sun to Earth and between the surface and the atmosphere E.A. Mathez, 2009, Climate Change: The Science of Global Warming and Our Energy Future, Columbia University Press. Source: Hartmann, 1994
049 Figure 5.3. The flow of energy from the Sun to Earth and between the surface and the atmosphere E.A. Mathez, 2009, Climate Change: The Science of Global Warming and Our Energy Future, Columbia University Press. Source: Hartmann, 1994
Surface Typical Albedo (%) Deep water, low wind, low latitude 7 Deep water, high wind, high latitude 12 Moist dark soil 10 Moist gray soil 15 Dry soil, desert 30 Wet sand 25 Dry light sand 35 Asphalt pavement 7 Concrete pavement 20 Short green vegetation 17 Dry vegetation 25 Coniferous forest 12 Deciduous forest 17 Forest with snow cover 25 Sea ice, no snow cover 30 Old, melting snow 50 Dry, cold snow 70 Fresh, dry snow 80 050 Table 5.1. Albedo of various surfaces E.A. Mathez, 2009, Climate Change: The Science of Global Warming and Our Energy Future, Columbia University Press. Source: Hartmann, 1994
051 Figure 5.4. Changes in global mean radiative forcings, 1750-2005 E.A. Mathez, 2009, Climate Change: The Science of Global Warming and Our Energy Future, Columbia University Press. Source: Forster et al., 2007
052 Figure 5.5. Contributions of different greenhouse gases to radiative forcing E.A. Mathez, 2009, Climate Change: The Science of Global Warming and Our Energy Future, Columbia University Press. Data from Forster et al., 2007
053 Figure 5.6. Spectral characteristics of the Sun and Earth’s atmosphere E.A. Mathez, 2009, Climate Change: The Science of Global Warming and Our Energy Future, Columbia University Press. Source: Rohde, Global Warming Art
054 Figure 5.7. Scanning electron microscope images of various aerosols E.A. Mathez, 2009, Climate Change: The Science of Global Warming and Our Energy Future, Columbia University Press. Photographs by V. Martins, NASA
055 Figure 5.8. Global distribution of aerosols, 2006 E.A. Mathez, 2009, Climate Change: The Science of Global Warming and Our Energy Future, Columbia University Press. Source: Reto Stöckli, NASA
Sulfate (sulfuric acid via sulfur dioxide from fossil-fuel burning) -0.4 ± 0.20 Organic carbon (from fossil-fuel and biomass burning) -0.05 ± 0.05 Black carbon (from incomplete fossil-fuel combustion) +0.20 ± 0.15 Smoke (compounds from forest fires) +0.03 ± 0.12 Nitrates (ammonium, from ammonia and NOx emissions) -0.10 ± 0.10 Anthropogenic dust (agriculture, cement production, drying soils) -0.1 ± 0.20 All aerosols combined, direct effects -0.50 ± 0.40 Increase in cloud albedo due to aerosols -0.3 to -1.8 Radiative forcing (watts per square meter) 056 Table 5.2. Model estimates of the direct effects of aerosols on radiative forcing Aerosol E.A. Mathez, 2009, Climate Change: The Science of Global Warming and Our Energy Future, Columbia University Press. Source: Forster et al., 2007
057 Figure 5.9. Stratospheric aerosol before and on several occasions after the eruption of Mount Pinatubo, June 15, 1991 E.A. Mathez, 2009, Climate Change: The Science of Global Warming and Our Energy Future, Columbia University Press. Source: NASA
058 Figure 5.10. Sunspots observed during a cycle of high sunspot activity, March 30, 2001 E.A. Mathez, 2009, Climate Change: The Science of Global Warming and Our Energy Future, Columbia University Press. Source: SOHO/MDI Consortium