Download
1 / 29
300 likes | 900 Vues
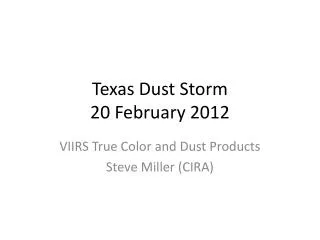
Dust Storm Shapes. Thunderstorm Outflow METEOROLOGIST JEFF HABY.

E N D
Thunderstorm OutflowMETEOROLOGIST JEFF HABY • An outflow boundary is generated from the divergence of air within the downdraft of a thunderstorm that crashes into the earth's surface. It is similar to smashing a water balloon on a concrete surface. The fluid spreads out in all directions once the fluid impacts the earth's surface. The outflow from a thunderstorm will spread most rapidly in the direction the low level winds are flowing. One side of the downdraft will have to flow against the prevailing low level wind flow while the other side will be flowing with the prevailing low level wind flow. The angle the downdraft accelerates into the earth's surface is also important in determining how the downdraft's air will be distributed once impacting the surface. The acceleration rate of the downdraft is also important. Intense evaporational cooling in the middle levels of the atmosphere, minimal influence of the updraft, and a warm PBL maximizes the acceleration of a downdraft of air.The "edge" of the outflow boundary can often be detected by Doppler radar (especially in clear air mode). Convergence occurs along the leading edge of the downdraft. Convergence of dust, aerosols, and bugs at the leading edge will lead to a higher clear air signature. The signature of the leading edge is also influenced by the density change between the cold air from the downdraft and the warm environmental air. This density boundary will increase the number of echo returns from the leading edge. Clouds, hydrometeors and new thunderstorms can also develop along the outflow's leading edge. This makes it possible to locate the outflow boundary when using precipitation mode. The image below is that of two outflow boundaries from two separate storms. Often, the outflow boundary will bow in the direction it is moving the quickest.
A thunderstorm outflow current visualized by bushfire smokeRichard Manasseh and Jason H. Middleton • Abstract: A coastal thunderstorm near Sydney, Australia, created an outflow gravity current that propagated for at least 45 km over the ocean. The outflow entrained air from a bushfire, making it visible. Thunderstorm-generated gravity currents are not always visible and the present data supports the observation that large gravity currents are known to occur in this area. • It is well known that thunderstorms can create gravity currents when they generate large outflows of cold air (Simpson 1987; Fulton et al 1990; Manasseh & Middleton 1995). Because the cold air is generated by the evaporation of precipitation, these horizontally-propagating currents are often invisible. If they pass over arid land they may entrain dust and are then visible; these phenomena are known as `haboobs' (Simpson 1987) in North Africa and parts of Europe. • A gravity current has a well-known structure consisting of a head and a following flow. The airflow within the head consists of a rapid feeder flow near the ground and in the direction of propagation of the current, which sweeps vertically upwards at the nose of the current and brings air to the top of the head. The head may have turbulent eddies on top of it caused by shear-flow instabilities, which may take the form of Kelvin-Helmholtz billows. Gravity currents can be hazardous to aircraft; the instantaneous wind speed change encountered in flying through a gravity current can be as much as 30-35 (60-70 knots) and aircraft have undergone structural failure while flying through the billows (Simpson 1987) although the major loss of aircraft and life in gust fronts has been associated with the loss of lift due to the wind shift. • The event occurred on 11 April 1994; times quoted are in Eastern Australian Standard Time, which is 10 hours in advance of Universal Time. The dry-bulb temperature at Sydney Airport was C and the relative humidity was about 41%. Winds at Sydney Airport were west-south-westerly at about 5-7 during the early afternoon of 11 April. Figure 1 is a map of the region of interest. • Fires were lit by the Sydney Water Board in forested areas around Cordeaux Reservoir as a routine hazard-reduction measure. These burn-offs occurred along two lines as shown in figure 1 and made a plume of smoke that was advected to the east by the prevailing wind. • 2 Observations • Visual observations were made from the 14th floor of a building at the University of New South Wales (UNSW). • The plume from the fires at Cordeaux Reservoir was noted from UNSW by 1430. Cumulus was observed to the south-south-west, and had clearly changed into cumulonimbus by 1550. • Figure 2 is a radar image taken at 1540. It shows a precipitation zone over the ocean about 40 km south-south-west of UNSW, co-incident with the thunderstorm observed from UNSW. The radar reflectivity peak corresponds to a zone of intense precipitation, with a rainfall rate greater than 100 . This was probably the source of cold downdrafts and outflows. The centre of this zone is also marked on figure
Vertical Structure of Thunderstorm OutflowsR. Craig Goff • Cold air outflow from thunderstorms has been observed from a multi-level 461 m tower in central Oklahoma. Four life-cycle stages are determined from 20 outflows sampled. Each outflow is affected by the behavior and character of the parent thunderstorm and by the flow and stratification in both the warm ambient air and the cold outflow air. This produces much variation from case to case and makes difficult the description of a representative outflow model. However, cases believed to depict each of the outflow stages are chosen and discussed in detail. • The study is confined to the tower layer depth and concentrates on the characteristics of the outflow's leading edge. Outflow origin is not discussed. The leading edge of the outflow is characterized by strong shears in horizontal and vertical winds. Updrafts, which occur in a 1.5 km wide band ahead of the outflow, often exceed 6 m s−1. Maximum low-level horizontal wind gusts are found to be directly related to the translational speed of the front. Frontal slopes up to 75° are commonly observed. The windshift zone precedes the outflow thermal boundary by about 1 km and in strong outflows, both coincide with a pressure jump. Outflow gust front may be observed up to 45 min before measurable precipitation commences and are frequently characterized by multiple surges. • Low-level stratification affects the slope of the gust front. If a strong surface inversion exists in the pre-outflow airmass, the outflow may have difficulty dislodging the dense air or may override it. In the case of an inversion base elevated off the ground, inflow air to the thunderstorm comes entirely from above the inversion and no well-defined gust front is observed at low levels. Evidence presented shows the possibility of cyclic formation and collapse of the gust front nose and the apparent related importance of low-level stratification. • The paper concludes with a qualitative discussion of forces affecting the outflow. Surface drag and pressure forces are found to he most important. Near the front pressure forces dominate, elsewhere drag forces. The outflow friction (separation) layer thickness is shown to be related to the pressure gradient force.
HIGH RESOLUTION NUMERICAL SIMULATIONS OF THUNDERSTORM OUTFLOW BOUNDARIESBruce D. Lee University of Northern Colorado • Thunderstorm outflow boundaries play a large role in convection initiation while also representing the vehicle for potentially damaging winds and dangerous wind shear impacting the aviation community. Yet, high resolution, three-dimensional numerical modeling studies adequate to resolve the fine-scale (~100-300 m) kinematic structure along these boundaries have not been done. Only recently, have comprehensive plans been considered for observational study of boundaries at the necessary resolution to document the fine-scale instability structures (e.g., IHOP). Understanding of the instabilities indigenous to the outflow boundary leading edge and head section is likely critical for explaining, at least in part, the localized distribution of moist convective forcing along outflow boundaries, the magnitude of both vertical and horizontal shears of importance to aviation, the development of gustnadoes, and possibly even the damage pattern for outflow-associated severe wind events. Of particular interest is lobe and cleft instability (Simpson 1969, 1972). Although a dominant instability type along outflows, lobe and cleft instability has received very little attention in the atmospheric sciences community due likely to the observational and computational restrictions associated with studying phenomenon on this scale. • A three-dimensional, non-hydrostatic, quasi-compressible convective cloud model (MSTFLOW, Lee and Wilhelmson, 1997) is being employed to simulate strong outflow boundaries. An idealized initial experiment framework featuring a neutrally stable environment, no moist microphysics, and a calm ambient environment is being used to produce baseline results that are readily understandable in the absense of the complexity associated with a more extensive parameter space. Preliminary experiments using a 40 m horizontal grid spacing and 40 m vertical grid spacing (near surface) have yielded interesting results. An evolving pattern of lobes and clefts has been resolved that shed light on the intricacies of the flow field at the outflow leading edge. The lobe and cleft structure greatly influences the three-dimensional horizontal and vertical wind field while also creating a pattern of counter-rotating vertical vortices, some of which are shed internally when the clefts collapse. These results as well as those from higher resolution simulations (of 25-30 m grid spacing) will be presented at the conference.
Gravity Currents (Density Currents) • I am interested in gravity currents, or " density currents", the flow of one liquid within another caused by the density difference between the fluids. The difference that provides the driving force may be due to dissolved or suspended material or to temperature differences. Since gravity currents are formed in many different natural situations and may also be man-made, knowledge of their properties is of importance in many scientific disciplines. Gravity currents have been studied in: Atmosphere , Earth Sciences , Oceans and in Laboratory Experiments . Atmosphere This gravity current in the atmosphere is the front of an outflow of cold air from a thunderstorm. It is about 1000 metres high and advancing at 25 metres per The front of this gravity current can be seen by suspended dust, but usually such fronts in the atmosphere are completely invisible, and their sudden wind changes present a serious hazard to aircraft. The most dangerous form of thunderstorm outflow is called a microburst . This is so small and appears so unexpectedly that it is difficult to give warning of its presence. The very large changes in wind that it can produce may only last for 2 to 4 minutes, but 18 aircraft accidents over the world have been solely attributed to microsbursts. A microburst is surrounded by a ring vortex, spreading along the ground. This sudden changes in wind may be lethal to aircraft approaching, or taking off, at comparatively low speeds Another gravity current of cold air is produced by the sea breeze, a result of the temperature difference between sea and land. As well as producing welcome cool air inland, a sea breeze front is capable of carrying pollution inland from Los Angeles, a distance of 40 miles • Much of the dynamics of gravity currents has been discovered from laboratory experiments in which salt water has been released from behind a lock gate into a large tank of fresh water. Simultaneous side and top views are shown of a 1% salt solution gravity current moving from left to right. Shadowgraph technique is used to display some of the internal structure of the flow, in which a beam of parallel light is deflected on a screen by density differences. • Features than can be seen here are; • Kelvin-Helmholtz billows. They form on the upper surface of the head of the current, and can also be seen in the plan view beneath. • Lobes and clefts which form at the leading edge of the front. • Streaks of over-run dense fluid near the floor. These longitudinal lines can be been in the upper view, rising from the floor as they approach the front
Gravity CurrentsJohn Simpson, UCambridge • Contents • The nature of gravity currents • Atmospheric gravity currents • Sea-breeze fronts • Gravity currents in satellite imagery • Fronts and topography • Environmental problems: atmosphere • Gravity currents in rivers, lakes and the ocean • Industrial problems with gravity currents • Avalanches • Volcanic gravity currents • The anatomy of a gravity current • Spread of dense fluid • Ambient stratification • Ambient turbulence • Viscous gravity currents • Suspension flows • Gravity currents on a rotating earth • Numerical models of gravity currents
Wind Speed Wind Gust
III. Desert Winds • Deserts are typically windy places because of intense solar heating. The heating goes more to sensible heating of the ground than to latent heating because of the lack of moisture. • These hot surfaces produce superadiabatic lapse rates in the lower layers of air. Hence, desert regions are areas where great instability occurs, leading to vigorous convection, and gusty surface winds. • A hot spot on the surface, such as a plowed field, may be accompanied by a horizontal wind shear caused by a nearby obstacle, leading to the ubiquitous dust devil. ( pics) • These are microscale systems that rarely cause damage, but larger dust devils can have wind speeds in excess of 73 km/hr and can cause damage to structures. • A common storm found in the Southwestern US is called a haboob or sand storm. These are associated with thunderstorms with gusty downdrafts but no rain because it evaporates before it hits the ground. These can be 100 km wide. • s
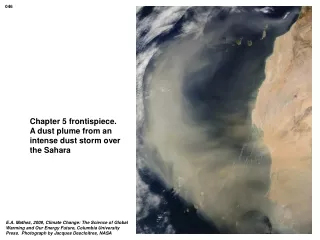
HABOOB • The name Haboob is the rooted from the Arabic word "phenomena". This form of monsoon occurs from May until September. It's a dust storm moving at a maximum speed of 80kph (50mph), the average speed is 50kph (30mph). The storm can reach up to heights of 3000 feet. They last about three hours, in which they change the desert landscape. The Haboob wind is caused by thunderclouds in a final phase. Downdrafts in a thunderstorm causes gust fronts, descending air hitting the grond and picking up large amounts of dust. The force moves the dust from above. In the Sahara there are 2 types of the Haboob. In the south a strong and hot version occurs, creating a common sandstorm. In the north the Haboob is colder and causes less dust storms than in the South. The Haboob also occurs in the southwest of the US. Especially in the dry states, suchs as Texas and Arizona. The photo above is from Lubbock, Texas. This haboob looks really scary, but fortunately it doesn't last long. However, it canT wreak havoc in those hours.
Blowing Dust in Lubbock, Texas • Blowing dust events also happen on a regular basis in this semiarid landscape. Although blowing dust can happen almost any time of the year in the Southern High Plains, the region is particularly vulnerable from late winter through late spring, when many large agricultural fields are bare and unvegetated, vulnerable to erosion by strong winds. Dust is also emitted from disturbed lands in the urban area. Under extremely strong winds, even partially vegetated land surfaces are subject to erosion. • Aeolian sediment transport (blowing sand, blowing dust, dust storms, dust haze) impacting Lubbock is generally caused by one of four meteorological mechanisms: • passage of fronts and troughs (including drylines), • downmixing of upper-level winds, • cyclogenesis, and • thunderstorm outflows (haboobs). • The majority (at least 2/3) of dust events are caused by the first two mechanisms, although the last two mechanisms result in the most dramatic dust clouds with the lowest visibilities.
Wave cyclones • The variable nature of weather in the midlatitudes is in part due to the presence of midlatitude, or extratropical cyclones. Appropriately called "wave cyclones", these systems take the form of an ocean wave when fully developed. Wave cyclones can grow to vast proportions, nearly 1000 miles (1600 km) wide. These vast areas of low pressure are born along the polar front where cold polar air from the north collides with warm tropical air to the south. In so doing, huge spiraling storms move across the surface guided by the polar front jet stream. • Initial Stage - Cyclogenesis • Wave cyclones form where surface convergence predominates. Cyclones often develop in the region of the Aleutian and Icelandic sub-polar low pressure cells. Wave cyclones also develop and intensify on the east slope of the Rocky Mountains, the Gulf Coast and east coasts of North America and Asia. • Figure WS.6 Air collides along polar front • Especially during the spring and summer in the midlatitudes of North America, high pressure to the north pushes cold polar air southward from Canada. To the south, maritime tropical air streams northward toward the polar air (Figure WS.6).The polar front is depicted by the symbols for a stationary front (the alternating red semi-circle and blue triangles). At the location where the opposing streams of air meet, cyclonic shear is created from opposing air streams sliding by each other causing the air to spin. You can demonstrate what happens as a result of cyclonic shear by placing a pencil between your hands. Push your right hand away from you (warm southerly flow) and draw your left hand towards you (cold, northerly flow). (Go ahead and try this to see if I'm right.) Examine what happens to the pencil. If you followed directions the pencil should be rotating in a counterclockwise fashion. Click here for more information about the initial stage of cyclone development. • Mature Stage • Figure WS.7 Open wave form of polar front cyclone • Once the air collides and cyclonic circulation commences, warm air from the south invades where cold air was once located north of the polar front (Figure WS.7). A warm front develops where warm air replaces the cold air. The position of a warm front on a weather map is depicted (in red) with a line showing the boundary between the air masses and semi-circles indicating the direction the front is moving. To the west of the center of the developing system, cold air is sliding south replacing warm air at the surface. A cold front (blue triangles) develops where cold air replaces the warm air. Soon the developing system takes on the characteristic wave form, hence their name "wave cyclone". The lowest pressure is found at the center or apex of the wave. • Figure WS.8 depicts the profile view of the open wave along a cross section just to the south of the system center. The less dense warmer air slide up and over the colder more dense air. Surface friction imposed by the ground slows the advance of the front compared to its position aloft yielding a gentle slope to the front.
`Microbursts • Each year microbursts damage at least a few homes and businesses across far western Texas and southern New Mexico, usually during the late spring, summer and early autumn. Remember when the National Weather Service issues a Severe ThunderstormWarning or a Tornado Warning, it means wind gusts of 58 mph or higher are expected along with the possibility of wind damage. Persons in the path of a severe thunderstorm must take shelter immediately in a strong building. Another danger from downbursts and microbursts is blowing dust and sand. During the summer of 2002, there were a number of downburst-induced blowing dust and sand events along Interstate 10 between Las Cruces and Lordsburg with the resultant low visibilities causing numerous motor-vehicle accidents. At least three people died in these wrecks. Thus travelers encountering obstructions to vision from blowing dust should drive well below normal speed limits, or even pull over and cease driving until the visibility has improved. Finally microbursts are extremely dangerous to aircraft, primarily during taking off and landing. In 1985, a microburst directly caused a major airline crash at Dallas-Fort Worth International Airport in Texas, killing 137 people. Pilots must accordingly obtain thorough weather briefings along their flight paths and avoid flying near showers and thunderstorms. In July, 2002, this downburst caused a major dust storm near Columbus, N.M. ( Photographed by Len Zgonina)
The gust front, marking the leading edge of a Forward Flank Downdraft, or FFD outflow of an HP supercell is so strong that is picks up dust from the ground. Since the outflow air is cooler, it races along the ground ahead of the storm at 60 MPH-plus. This is sometimes called a "Haboob" in the SW United States. The view is to the west towards Meade, Kansas on May 27, 2001. The supercell core is to the far right. Note the "cold front slope" the cooler dusty air has contrasted against the "cleaner" air ahead of the storm. Chase Log • A brief and violent dry microburst slams into the ground at over 65 MPH during the gustout stage of an HP supercell in Clarke County, Kansas on May 27, 2001. The microburst is dry because it occurred on the leading edge of a powerful gust front preceding the HP supercell. Note that the air is pressed into a very shallow layer that curls up at the leading edge of the microburst, as marked by dust being lofted. The strongest winds are just behind the "curl" in the shallow layer known as a "cusion" or "impact" stage of the microburst, containing extreme winds.
Postcard Kuwait Dust
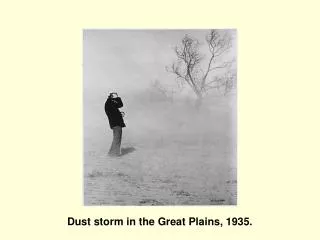
DustBowl • This map shows the states that were considered dust bowl states and the areas affected by dust storms. Notice that many states not considered dust bowl states were still damaged by dust storms. The whole middle of the United States was literally blowing away. • Dust Storm Damage, 19030-1940 An outline map of continental United States also shows the outline of each state. The map key uses colors to represent data as follows: brown represents the Dust Bowl States, red indicates the area with the most severe dust storm damage, yellow indicates other areas damaged by dust storms. • The following states are labeled by name and shaded proportionately with the following colors: • Texas: 45% brown, 45% yellow, and 10 % redNew Mexico: 60 % brown, 20% yellow, and 20 % red Oklahoma: 20% brown, 60% yellow, and 20 % red Kansas: 5% brown, 5 % red, and 90% yellow Colorado: 20% brown, 60% yellow, and 20 % red Nebraska: 100% yellow South Dakota: 75% of the entire state, mostly the west and the south, are yellow. Wyoming: 40 % of the state, mostly the east, is shades yellow. Montana: 15 % of the state, mostly the southwest corner, is shaded yellow.
Dust Storm hit the University of Oklahoma • Oct 15, 2001 A pretty strong cold front moved through and brought with it a fair amount of dust.These pictures from the 14th floor of the Sarkey's Energy Center
Jim Pics USGS Dust Studies
Canadian Dust • Dustbowl - first dust storm of the year blankets plains city • esday afternoon and evening, May 22, 2002, the combination of high winds and severe drought conditions created the first dust storm of the year in this part of the Canadian praries. The Saskatoon Star Pheonix featured a picture of the downtown core being enveloped by a large dust cloud. The caption on the photograph reads 'A cyclist looks eastward on 20th street to see Saskatoon's downtown disappear in dust that enfulfed the city late Tuesday afternoon.' This morning the winds have died down a little, but the city is still wrapped in a haze and a film of dust coats automobiles. An elderly gentelman said, 'I lived through the dirty thirties once and I shouldn't have to do it again.' The Saskatoon dust storm follows on the heels of a cloud of smoke which enveloped the city of Edmonton. According to the story as reported by the CBC, 200 Forest and grass fires are burning in the `Canadian west, due to a combination of drought and high winds...Tuesday May 21 -> CBC : Smoke cloud covers Edmonton, a city on the Canadian praries in the province of Alberta to the West of Saskatchewan...The fields in Saskatchewan are dried and yellow brown and the other weekend I watched as men walked accross bone dry soil with clouds of dust being raised by each foot fall, and I knew at the time that great dust storms were inevitable. The drought conditions have also spread in the western parts of the American plains. See the page Drought Report and as well as the page with a couple of snap shots of one of these dust storms. A long list of links to drought resources is on the Drought Watch page ... ... and from last year, on the prophecy page, Mountain drought and Summer is over, harvest is past, and we are not saved The Severe Weather map on the Wunderground site shows in blue, the high wind warnings for the drought stricken areas, raising the possibility of more dust storms in the United States, as well. The Green on the right shows the areas that were flooded all winter with the flooding following the Mississippi. The West Nile virus has reached this flooded area and in an ominous example of synchronicity the area was flooded all winter and spring, raising the possibility of the threat of West Nile Virus outbreaks as mosquitoe breeding season begins. Between drought, flooding, and the West Nile Virus, it looks bad year for farmers and for the MidWest of both Canada and the United States...
6/29/03 Dust Storm over Edwards Air Force Base, CAPhotographer: TSgt Matthew Kelpis - matthew.kelpis@edwards.af.mil
Outflow Gallery • Haboob • Dense outflow from a line of severe thunderstorms over southwest KS generated this convectively generated sandstorm -- a haboob. The angled edge of the dust and sand plume, extending downward and leftward from the arcus cloud's tip, sharply marks the outflow pool. Yes, we let it engulf us, to be greeted by measured winds up to 68 mph and intense blasts of sand which scratched and pitted my windshield. Deeply embedded in the dense brown murk, I drove southward at over 60 mph, holding my hand out the windshield and feeling no wind whatsoever against my skin. What a rare and eerie experience! This was the earliest stage and the northwestern end of a derecho (large well-organized, severe convective wind damage event) that wrecked buildings, trees and signs across much of southwestern KS, OK and portions of north TX. • 2 SE Sublette KS (27 May 1) looking WNW
This wonderful outflow boundary produced a nice dust storm. In Arizona, they call this a Haboob
Cyclone Families - Cyclogenesis Regions • Mid-latitude Cyclones - Introduction • "The Perfect Storm" • Important for global heat transport • They also redistribute/reduce energy in the atmosphere • Often are significant weather producers • First studied extensively by a group of scientists from Bergen, Norway (Vilhelm and Jakob Bjerknes, Halvor Solberg, and Tor Bergeron) • They developed the Polar Front Theory for the formation and evolution of mid-latitude cyclones shortly after WWI. • Many cyclones in different phases of their evolution are often observed along the polar front • Cyclogenesis over the US tends to occur near: • Eastern Slope of the Rockies • The Great Basin Area • Gulf of Mexico • Atlantic Coast east of the Carolinas • Sometimes, cyclones deepen very rapidly - if deepening rate exceeds 24 mb in 24 hours, it is referred to as explosive cyclogenesis and the associated storm is often called a "bomb" • Explosive cyclogenesis often occurs during the winter months just off the east coast of the US • (c)- A fully-developed "wave cyclone" is seen 12-24 hours from its inception. It consists of: • a warm front moving to the northeast • a cold front moving to the southeast • region between warm and cold fronts is the "warm sector" • the central low pressure (low, which is deepening with time) • overrunning of warm air over the warm front • cold air surging southward behind the cold front • wide-spread precip ahead of the warm front • narrow band of precip along the cold front • Wind speeds continue to get stronger as the low deepens - the Available Potential Energy (APE)is being converted to Kinetic Energy (KE) • Vertical Structure of a Developing Wave Cyclone • Mid-latitude cyclones are "deep" pressure systems extending from the surface to tropopause level • recall that they are an example of a "cold core low" • For the storm to develop and grow, it can not be vertically "stacked" as shown to the right -->>
Grassland Dust Storm • A Midland man captured a series of images of the dust storm that swept through West Texas two weeks ago, and is sharing them with other readers of the mywesttexas.com web site. • "This is a sequence of photo's taken June 3rd, as the dust storm approached the Grasslands subdivision," said Bill Hardie, who sent the photo. "We've had several dust storms this year. This one came from an outflow of a storm about 50 miles northeast of Midland.“ • "At this point, it was very calm, and the birds were singing." • Needless to say, everything has been powdercoated." Greenwood Dust Storm Kermit Sand Dunes
COMET Forecasting Dust Storms • Table of Contents • 0. Goals and Objectives 1. Scenario2. Introduction 2.1 Introduction3. Physical Processes3.1 Dust 3.2 Wind 3.3 Dispersion of Dust4. Dust Source Regions4.0 Introduction4.1 Global 4.2 Middle East and SW Asia5. Synoptically-forced Dust Storms5.1 Introduction – emphasis on Middle East 5.2 Prefrontal Events 5.3 Postfrontal Dust Storms 5.4 Summer Shamal6. Dust Storms – Mesoscale • 6.1 Introduction 6.2 Gap Flow Dust Storms 6.3 Haboobs 6.4 Inversion Downburst Dust Storms 6.5 Dust Devils7. Climatology8. Satellite Detection of Dust9. Forecasting9.1 Introduction / Observations 9.2 NWP Models 9.3 Dust Models10. Summary