Download
1 / 2
20 likes | 195 Vues
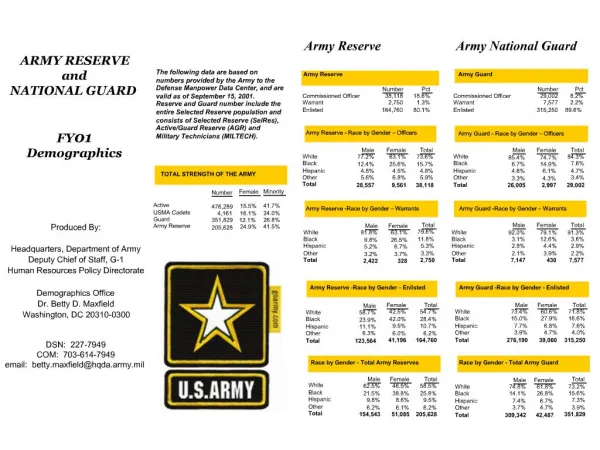
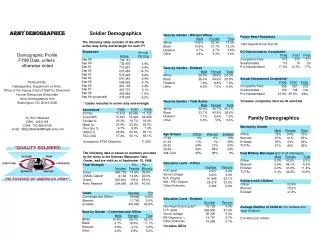
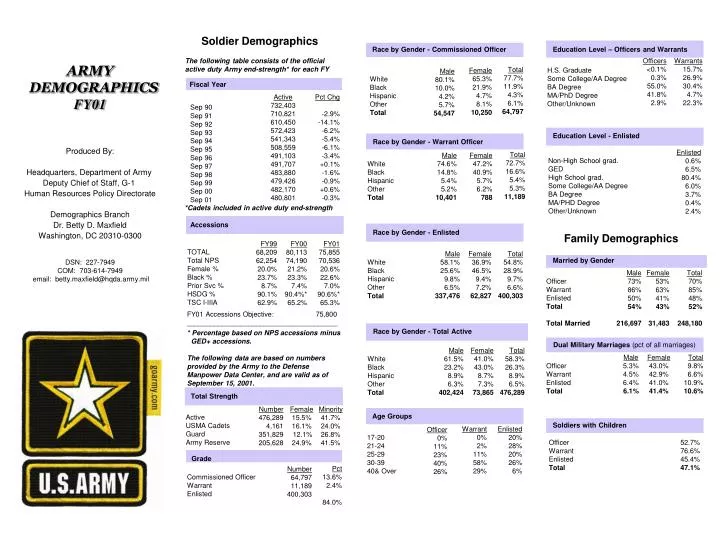
Soldier Demographics. Race by Gender - Commissioned Officer. Education Level – Officers and Warrants. H.S. Graduate Some College/AA Degree BA Degree MA/PhD Degree Other/Unknown. White Black Hispanic Other Total .

E N D
Soldier Demographics Race by Gender - Commissioned Officer Education Level – Officers and Warrants H.S. Graduate Some College/AA Degree BA Degree MA/PhD Degree Other/Unknown White Black Hispanic Other Total The following table consists of the official active duty Army end-strength* for each FY Officers <0.1% 0.3% 55.0% 41.8% 2.9% Warrants 15.7% 26.9% 30.4% 4.7% 22.3% Total 77.7% 11.9% 4.3% 6.1% 64,797 Female 65.3% 21.9% 4.7% 8.1% 10,250 Male 80.1% 10.0% 4.2% 5.7% 54,547 ARMY DEMOGRAPHICS FY01 Produced By: Headquarters, Department of Army Deputy Chief of Staff, G-1 Human Resources Policy Directorate Demographics Branch Dr. Betty D. MaxfieldWashington, DC 20310-0300 DSN: 227-7949 COM: 703-614-7949 email: betty.maxfield@hqda.army.mil Fiscal Year Sep 90 Sep 91 Sep 92 Sep 93 Sep 94 Sep 95 Sep 96 Sep 97 Sep 98 Sep 99Sep 00 Sep 01 Active732,403 710,821 610,450 572,423 541,343 508,559 491,103 491,707 483,880 479,426482,170 480,801 Pct Chg -2.9% -14.1% -6.2% -5.4% -6.1% -3.4% +0.1% -1.6% -0.9%+0.6% -0.3% Education Level - Enlisted Race by Gender - Warrant Officer Non-High School grad. GED High School grad. Some College/AA Degree BA Degree MA/PHD Degree Other/Unknown White Black Hispanic Other Total Enlisted 0.6% 6.5% 80.4% 6.0% 3.7% 0.4% 2.4% Total 72.7% 16.6% 5.4% 5.3% 11,189 Male 74.6% 14.8% 5.4% 5.2% 10,401 Female 47.2% 40.9% 5.7% 6.2% 788 *Cadets included in active duty end-strength Accessions Race by Gender - Enlisted Family Demographics White Black Hispanic Other Total TOTAL Total NPS Female % Black % Prior Svc % HSDG % TSC I-IIIA FY99 68,209 62,254 20.0% 23.7% 8.7% 90.1% 62.9% FY00 80,113 74,190 21.2% 23.3% 7.4% 90.4%* 65.2% FY01 75,855 70,536 20.6% 22.6% 7.0% 90.6%* 65.3% Male 58.1% 25.6% 9.8% 6.5% 337,476 Female 36.9% 46.5% 9.4% 7.2% 62,827 Total 54.8% 28.9% 9.7% 6.6% 400,303 Married by Gender Officer Warrant Enlisted Total Total Married Male 73% 86% 50% 54% 216,697 Female 53% 63% 41% 43% 31,483 Total 70% 85% 48% 52% 248,180 FY01 Accessions Objective: 75,800 _______________________________________ * Percentage based on NPS accessions minus GED+ accessions. The following data are based on numbers provided by the Army to the Defense Manpower Data Center, and are valid as of September 15, 2001. Race by Gender - Total Active White Black Hispanic Other Total Male 61.5% 23.2% 8.9% 6.3% 402,424 Female 41.0% 43.0% 8.7% 7.3% 73,865 Total 58.3% 26.3% 8.9% 6.5% 476,289 Dual Military Marriages (pct of all marriages) Officer Warrant Enlisted Total Male 5.3% 4.5% 6.4% 6.1% Female 43.0% 42.9% 41.0% 41.4% Total 9.8% 6.6% 10.9% 10.6% Active USMA Cadets Guard Army Reserve Female 15.5% 16.1% 12.1% 24.9% Minority 41.7% 24.0% 26.8% 41.5% Total Strength Number 476,289 4,161 351,829 205,628 Age Groups Soldiers with Children 17-20 21-24 25-29 30-39 40& Over Warrant 0% 2% 11% 58% 29% Enlisted 20% 28% 20% 26% 6% Officer 0% 11% 23% 40% 26% Officer Warrant Enlisted Total 52.7% 76.6% 45.4% 47.1% Grade Commissioned Officer Warrant Enlisted Pct 13.6% 2.4% 84.0% Number 64,797 11,189 400,303
Army Civilian Employees* by Minority Status and Grade (excludes National Guard) Employed - Full-Time Employed - Part-Time Unemployed * Wants job but not looking Not working, doesn’t want job Deaths of Active Duty* Soldiers by Selected Causes Employment Status of Civilian Spouses (as of Spring 2001) Majority Minority GS 1-4 GS 5-8 GS 9-12 GS/GM 13-15 TOTAL GS/GM SES Average Number of Children (for soldiers who have children) Enl 37% 18% 17% 12% 15% Ofcr 32% 17% 9% 12% 30% 2 children per soldier FY99 187 123 40 24 64 63 17 331 FY00 161 113 16 32 63 58 13 295 FY01 168 99 33 36 22 74 42 18 324 Accidents POV Mil Training** Other Terrorist Illness Suicides Homicide TOTAL FY90 61.9% 72.1% 81.3% 89.3% 75.0% 95.1% FY01 53.3% 64.0% 75.4% 83.8% 71.9% 92.3% FY90 39.1% 27.9% 18.7% 10.2% 25.0% 4.8% FY01 46.7% 36.0% 24.6% 16.2% 28.1% 7.7% Sole Parents* Commissioned/Warrant Officer 3.6% Enlisted 8.2% TOTAL 7.5% * Single with Children TOTAL all pay plans * Appropriated Fund employees only 74.3% 72.2% 25.7% 27.8% * Unemployed means actively looking for work. Family Members Spouses Children Other Dependents TOTAL Source: Sample Survey of Military Personnel * Includes Reserve/Nation Guard deaths. ** Includes military vehicle and Aviation (flight-related) deaths. 245,993 449,849 3,457 699,299 U.S. Army Retirees EO / Sexual Harassment 20+ Yrs of Service TERA* Disabled - Temporary Disabled - Permanent TOTAL Number of Victims Rate/1,000 Army FY 01 Family Violence - Substantiated Spouse Abuse 418,926 20,684 2,977 84,668 527,255 FY99 4,798 7.2 FY00 4,151 6.4 FY01 3,948 6.3 EO Discrimination Complaints* Complaints Filed Substantiated Pct Substantiated Avg Soldier’s Pay (E4, 4 years of service, with dependents) – January 2002 Base Pay: BAH: BAS: TOTAL FY99 299 34 11% FY00 207 29 14% FY01 129 24 19% $1,680 per month 484 per month 230 per month $2,394 per month * Temporary Early Retirement Authority (15-20 years of service) U.S. Army Civilians $28,728 per year FY01 100 45 45% Sexual Harassment Complaints* Purple Heart Recipients* 1093 Awards *Dec 89 to Sep 01 Complaints Filed Substantiated Pct Substantiated Army Civilians* FY01 (excludes National Guard) FY99 150 74 49% FY00 135 58 43% FY90 539,417 FY01 195,106 Food Stamps - vouchers redeemed in Army Commissaries, FY01 Food Stamps WIC* * Appropriated Fund civilian employees only $6,644,553 $8,835,000 *Includes complaints filed via IG and EOA * Women, Infants and Children Program U.S. Population Statistics Health Issues Army Civilian Employees by Gender and Grade (excludes National Guard) Male Female GS 1-4 GS 5-8 GS 9-12 GS/GM 13-15 TOTAL GS/GM SES Population Estimates by Age 17-19 and Race HIV+ Soldiers on Duty* 2020 56.4% 14.2% 22.3% 7.1% 2000 66.7% 14.4% 13.8% 5.1% 2005 64.6% 14.7% 15.2% 5.4% 2010 61.1% 14.8% 17.9% 6.1% 2015 59.3% 13.9% 20.3% 6.5% Soldiers with Exceptional* Family Members Soldiers Family Members HIV+ Soldiers * As of 30 Sep 2001 White Black Hispanic Other Source: U.S. Census Active 279 AR/NG 90 FY01 68.3% 65.2% 41.4% 24.3% 47.3% 14.6% FY 01 44,158 54,586 Pct 9.3% 7.8% FY90 22.1% 29.2% 64.4% 86.0% 46.3% 95.1% FY01 31.7% 34.8% 58.6% 75.7% 52.7% 85.4% FY90 77.8% 70.7% 35.5% 14.0% 53.6% 4.8% TOTAL all pay plans * Appropriated Fund employees only New Cases of HIV+ Fiscal Year* *Anyone with any physical, emotional, developmental, or intellectual disability who requires special treatment, therapy, education,training, or counseling. Active AR/NG 1997 60 31 1998 60 29 1999 54 38 2000 41 19 2001 57 21 57.4% 60.5% 42.5% 39.5% *FY of first known HIV+ test. All totals are confirmed HIV cases having at least 2 positive tests with 2nd test being a confirmatory test.