Download
1 / 15
150 likes | 224 Vues
ccagtcagag A tgtgcacatggcttagttttcataca G agcctgggctgggggtggggtg ccagtcagag A tgtgcacatggcttagttttcatacacagcctgggctgggggtggggtg ccagtcagagttgtgcacatggcttagttttcatacacagcctgggctgggggtggggtg ccagtcagag A tgtgcacatggcttagttttcatacacagcctgggctgggggtggggtg

E N D
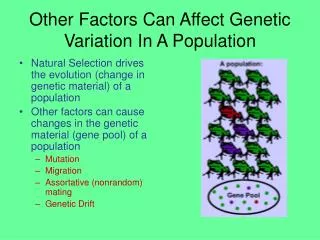
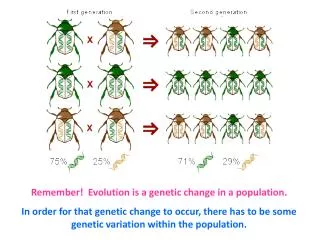
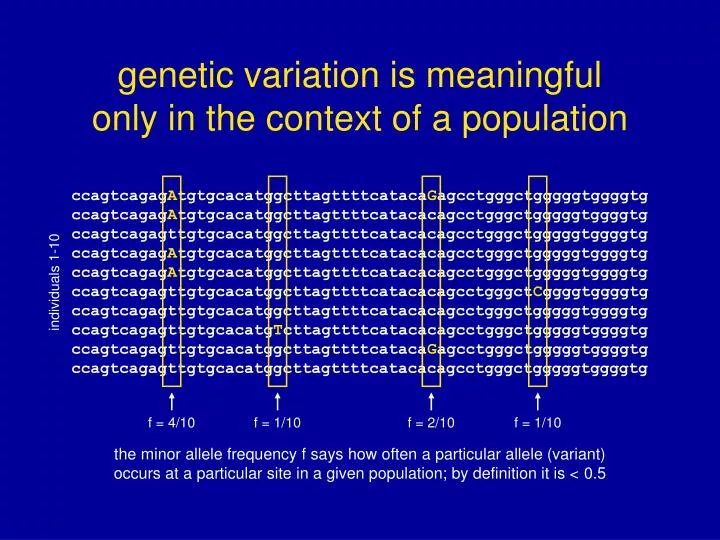
ccagtcagagAtgtgcacatggcttagttttcatacaGagcctgggctgggggtggggtg ccagtcagagAtgtgcacatggcttagttttcatacacagcctgggctgggggtggggtg ccagtcagagttgtgcacatggcttagttttcatacacagcctgggctgggggtggggtg ccagtcagagAtgtgcacatggcttagttttcatacacagcctgggctgggggtggggtg ccagtcagagAtgtgcacatggcttagttttcatacacagcctgggctgggggtggggtg ccagtcagagttgtgcacatggcttagttttcatacacagcctgggctCggggtggggtg ccagtcagagttgtgcacatggcttagttttcatacacagcctgggctgggggtggggtg ccagtcagagttgtgcacatgTcttagttttcatacacagcctgggctgggggtggggtg ccagtcagagttgtgcacatggcttagttttcatacaGagcctgggctgggggtggggtg ccagtcagagttgtgcacatggcttagttttcatacacagcctgggctgggggtggggtg individuals 1-10 f = 4/10 f = 1/10 f = 2/10 f = 1/10 the minor allele frequency f says how often a particular allele (variant) occurs at a particular site in a given population; by definition it is < 0.5 genetic variation is meaningfulonly in the context of a population
the polymorphisms most analyzed are:single nucleotide polymorphisms (SNPs) replace one bp with another but do not change lengths1 SNP per 1000 bp between any two individuals; almost every bp is variable when we consider the world populationSNPs are essentially always bi-allelic; not because tri-allelics are impossible, just highly unlikelyother polymorphism categories include:small insertions-deletions (indels) below reads lengthlarge structural variations consisting of insertions and deletions and inversions above reads length
# of SNPs found = 1541 1000 NonSyn Synon 5'-UTR 750 3'-UTR Frame Splice 500 # of SNPs 5'-Flank 3'-Flank Intron 250 0 0 0.1 0.2 0.3 0.4 0.5 f (minor allele) SNPs approximate 1/f distribution this is the observed frequency distribution from the complete sequencing a large population; however many SNP discovery projects sequence a small population and then consider the absence or presence of those previously discovered SNPs in a large population; this is known to underestimate the number of rare variants
population specific SNPs arefound at lower f than shared ones minor allele frequencies classified by occurrence within individuals of either African or European descent (population specific) or presence in both (shared) as shown by Halushka MK, …, Chakravarti A. 1999. Nat Genet 22: 239-347
GENOTYPEfirst we identify variant sites by sequencing a small number of individuals; then we test (i.e. genotype) only those variant sites to determine which alleles are presentRE-SEQUENCE[inconsistently used terminology]generate low coverage (2x) sequence from one individual and compare that data against the reference genomeDE NOVOgenerate high coverage (50x) sequence from one individual and perform de novo assembly of that genome without making use of the existing reference genome
growth in public databases for “common” human polymorphisms 18 October 2007 3.1 million SNPs genotyped in 270 individuals from four diverse populations 27 October 2005 one million SNPs genotyped in 269 individuals from four diverse populations 28 October 2010 15 million SNPs, one million short insertion-deletion, 20000 structural variants genotyped in up to 697 individuals from 7 diverse populations worldwide
structural variations detected by fosmid end-sequence pairs (ESPs) the fosmid cloning system generates an exceptionally narrow distribution of clone insert sizes, 40 ± 2.8 kb; each of these fosmid clones is sequenced from both ends, creating an end-sequence pair with two 500 bp sequence reads separated by a known distance in the test genome from which the fosmid clone was made; insertions-deletions-inversions are detected by computationally aligning end-sequence pairs to the reference genome
10 kb deletion relative to reference 50 kb on REF arrows indicate direction of sequence read deleted 10 kb REF genome test genome 40 kb on test
structural variations follow a1/f distribution just like SNPs 15% (261 of 1,695) of discovered sites represent the more common configuration than the reference human genome JM Kidd, et al. 2008. Mapping and sequencing of structural variation from eight human genomes. Nature 453: 56-64
human pan-genome: non-redundant collection of sequences found across the entire world’s human population de novo assembly of individual genome reveals ~5 Mb of novel sequence not present in reference genome; complete human pan-genome contains 19~40 Mb of novel sequence not present in reference genome R Li, et al. 2010. Building the sequence map of the human pan-genome. Nat Biotechnol 28: 57-63.
Lewontin’s (in)famous paper on non-existence of “race” in genetics Lewontin RC. 1972. "The apportionment of human diversity“, in Evolutionary Biology 6: 391-398 most of the variations (85%) found in human populations is found within local geographic groups and any differences attributable to race groups is just a small fraction of human genetic variability (15%); race is an invalid taxonomic construct because the probability of a racial misclassification is approximately 30% based on a single genetic locus Edwards AW. 2003. Human genetic diversity: Lewontin's fallacy. Bioessays 25: 798-801 even if the probability of misclassifying an individual’s race based on a single locus is as high as 30%, the misclassification probability based on 10 loci can drop to a few percent
Structure clustering of genotype data Africa Europe Asia Rosenberg NA, …, Feldman MW. 2002. Science 298: 2381-2385 This analysis is based on 377 microsatellites in 1056 individuals from 52 populations. Variations within populations account for 93 to 95% of the data. Nevertheless we can identify clusters that are consistent with known populations. K is chosen in advance. For any given K, each individual is represented by a thin vertical line, which is partitioned into K colored segments indicating the individual’s estimated membership in the preordained K clusters.
science does notdictate public policy science can and should inform policy but that is never the only consideration, and in the meantime there are better (or at least more fun) things to do with the decreasing cost of sequencing, the age of personal genomics is fast approaching; we need not limit ourselves to sequencing live individuals
human genome sequencefrom an extinct Palaeo-Eskimo Kennewick Man is but the tip of the iceberg for the New World Entrada controversy. Who occupied the American continents first and where did they come from? These questions are intricately connected with the rights of indigenous Native Americans. Sequencing of a pre-Clovis genome over 11,500 years old would rattle the field. evidence of migration from Siberia into the New World some 5,500 years ago independent of migrations giving rise to modern Native Americans and Inuits M Rasmussen, et al. Feb 2010. Nature 463: 757-762.
personal genomes for $199 Anne Wojcicki and Sergey Brin