Download
1 / 1
10 likes | 159 Vues
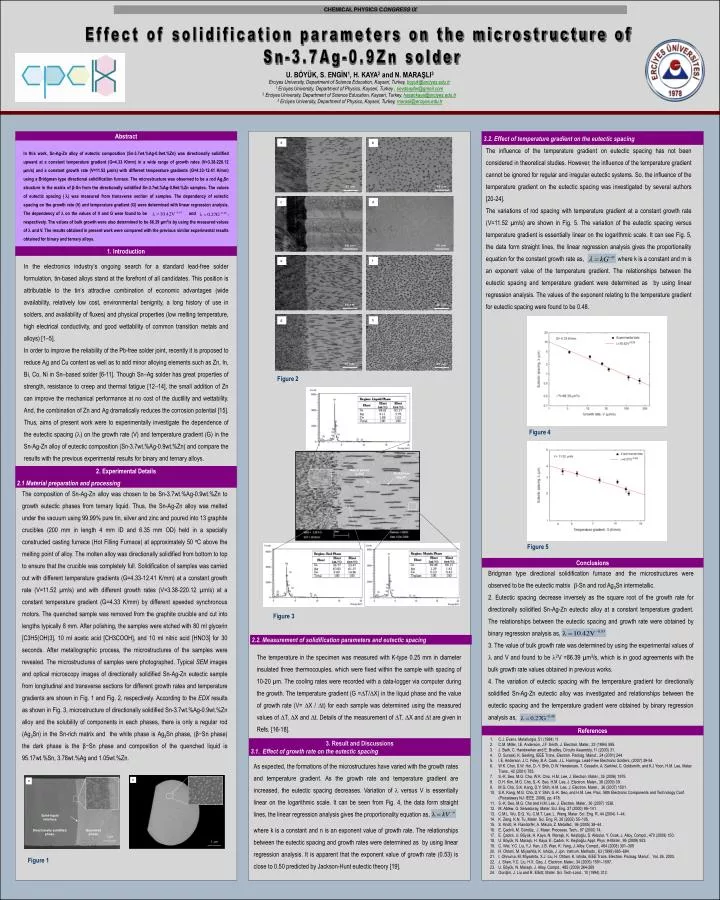
Matrix phase (b -Sn). Rod phase (Ag 3 Sn). a. b. m. m. 4. 0. m. 4. 0. m. c. d. m. m. 4. 0. m. 4. 0. m. e. f. m. 4. 0. m. m. 4. 0. m. g. h. m. 4. 0. m. m. 4. 0. m. a. Solid-liquid interface. Directionally solidified phase. Quenched phase. 1 m m.

E N D
Matrix phase (b-Sn) Rod phase (Ag3Sn) a b m m 4 0 m 4 0 m c d m m 4 0 m 4 0 m e f m 4 0 m m 4 0 m g h m 4 0 m m 4 0 m a Solid-liquid interface Directionally solidified phase Quenched phase 1 mm CHEMICAL PHYSICS CONGRESS IX Effect of solidification parameters on the microstructure of Sn-3.7Ag-0.9Zn solder U. BÖYÜK, S. ENGİN1, H. KAYA2 and N. MARAŞLI3 Erciyes University, Department of Science Education, Kayseri, Turkey, boyuk@erciyes.edu.tr 1 Erciyes University, Department of Physics, Kayseri, Turkey , sevdaayfer@gmail.com 2Erciyes University, Department of Science Education, Kayseri, Turkey, hasankaya@erciyes.edu.tr 3Erciyes University, Department of Physics, Kayseri, Turkey, marasli@erciyes.edu.tr 3.2. Effect of temperature gradient on the eutectic spacing Abstract The influence of the temperature gradient on eutectic spacing has not been considered in theoretical studies. However, the influence of the temperature gradient cannot be ignored for regular and irregular eutectic systems. So, the influence of the temperature gradient on the eutectic spacing was investigated by several authors [20-24]. The variations of rod spacing with temperature gradient at a constant growth rate (V=11.52 µm/s) are shown in Fig. 5. The variation of the eutectic spacing versus temperature gradient is essentially linear on the logarithmic scale. It can see Fig. 5, the data form straight lines, the linear regression analysis gives the proportionality equation for the constant growth rate as,where k is a constant and m is an exponent value of the temperature gradient. The relationships between the eutectic spacing and temperature gradient were determined as by using linear regression analysis. The values of the exponent relating to the temperature gradient for eutectic spacing were found to be 0.48. In this work, Sn-Ag-Zn alloy of eutectic composition (Sn-3.7wt.%Ag-0.9wt.%Zn) was directionally solidified upward at a constant temperature gradient (G=4.33 K/mm) in a wide range of growth rates (V=3.38-220.12 µm/s) and a constant growth rate (V=11.52 µm/s) with different temperature gradients (G=4.33-12.41 K/mm) using a Bridgman type directional solidification furnace. The microstructure was observed to be a rod Ag3Sn structure in the matrix of β-Sn from the directionally solidified Sn-3.7wt.%Ag-0.9wt.%Zn samples. The values of eutectic spacing () was measured from transverse section of samples. The dependency of eutectic spacing on the growth rate (V) and temperature gradient (G) were determined with linear regression analysis. The dependency of on the values of V and G were found to be and , respectively. The values of bulk growth were also determined to be 86.39 µm3/s by using the measured values of and V. The results obtained in present work were compared with the previous similar experimental results obtained for binary and ternary alloys. 1. Introduction In the electronics industry’s ongoing search for a standard lead-free solder formulation, tin-based alloys stand at the forefront of all candidates. This position is attributable to the tin’s attractive combination of economic advantages (wide availability, relatively low cost, environmental benignity, a long history of use in solders, and availability of fluxes) and physical properties (low melting temperature, high electrical conductivity, and good wettability of common transition metals and alloys) [1–5]. In order to improve the reliability of the Pb-free solder joint, recently it is proposed to reduce Ag and Cu content as well as to add minor alloying elements such as Zn, In, Bi, Co, Ni in Sn–based solder [6-11]. Though Sn–Ag solder has great properties of strength, resistance to creep and thermal fatigue [12–14], the small addition of Zn can improve the mechanical performance at no cost of the ductility and wettability. And, the combination of Zn and Ag dramatically reduces the corrosion potential [15]. Thus, aims of present work were to experimentally investigate the dependence of the eutectic spacing () on the growth rate (V) and temperature gradient (G) in the Sn-Ag-Zn alloy of eutectic composition (Sn-3.7wt.%Ag-0.9wt.%Zn) and compare the results with the previous experimental results for binary and ternary alloys. Figure 2 Figure 4 2. Experimental Details 2.1 Material preparation and processing The composition of Sn-Ag-Zn alloy was chosen to be Sn-3.7wt.%Ag-0.9wt.%Zn to growth eutectic phases from ternary liquid. Thus, the Sn-Ag-Zn alloy was melted under the vacuum using 99.99% pure tin, silver and zinc and poured into 13 graphite crucibles (200 mm in length 4 mm ID and 6.35 mm OD) held in a specially constructed casting furnace (Hot Filling Furnace) at approximately 50 oC above the melting point of alloy. The molten alloy was directionally solidified from bottom to top to ensure that the crucible was completely full.Solidification of samples was carried out with different temperature gradients (G=4.33-12.41 K/mm) at a constant growth rate (V=11.52 µm/s) and with different growth rates (V=3.38-220.12 µm/s) at a constant temperature gradient (G=4.33 K/mm) by different speeded synchronous motors. The quenched sample was removed from the graphite crucible and cut into lengths typically 8 mm. After polishing, the samples were etched with 80 ml glycerin [C3H5(OH)3], 10 ml acetic acid [CH3COOH], and 10 ml nitric acid [HNO3] for 30 seconds. After metallographic process, the microstructures of the samples were revealed. The microstructures of samples were photographed. Typical SEM images and optical microscopy images of directionally solidified Sn-Ag-Zn eutectic sample from longitudinal and transverse sections for different growth rates and temperature gradients are shown in Fig. 1 and Fig. 2, respectively.According to the EDX results as shown in Fig. 3, microstructure of directionally solidified Sn-3.7wt.%Ag-0.9wt.%Zn alloy and the solubility of components in each phases, there is only a regular rod (Ag3Sn) in the Sn-rich matrix and the white phase is Ag3Sn phase, (β−Sn phase) the dark phase is the β−Sn phase and composition of the quenched liquid is 95.17wt.%Sn, 3.78wt.%Ag and 1.05wt.%Zn. Figure 5 In present work, Sn-Ag-Zn eutectic alloy was solidified unidirectional using a Bridgman type directional solidification furnace and the microstructures were observed to be the eutectic matrix -Sn and rod Ag3Sn intermetallic. 2. Eutectic spacing decrease inversely as the square root of the growth rate for directionally solidified Sn-Ag-Zn eutectic alloy at a constant temperature gradient. The relationships between the eutectic spacing and growth rate were obtained by binary regression analysis as, 3. The value of bulk growth rate was determined by using the experimental values of and V and found to be 2V =86.39 µm3/s, which is in good agreements with the bulk growth rate values obtained in previous works. 4. The variation of eutectic spacing with the temperature gradient for directionally solidified Sn-Ag-Zn eutectic alloy was investigated and relationships between the eutectic spacing and the temperature gradient were obtained by binary regression analysis as, Conclusions Figure 3 2.2. Measurement of solidification parameters and eutectic spacing The temperature in the specimen was measured with K-type 0.25 mm in diameter insulated three thermocouples, which were fixed within the sample with spacing of 10-20 µm. The cooling rates were recorded with a data-logger via computer during the growth. The temperature gradient (G =T/X) in the liquid phase and the value of growth rate (V= X / t) for each sample was determined using the measured values of T, X and t. Details of the measurement of T, X and t are given in Refs. [16-18]. References • C.J. Evans, Metallurgia, 51 (1984) 11. • C.M. Miller, I.E. Anderson, J.F. Smith, J. Electron. Mater., 23 (1994) 595. • J. Bath, C. Handwerker and E. Bradley, Circuits Assembly, 11 (2000) 31. • D. Suraski, K. Seeling, IEEE Trans. Electron. Packag. Manuf., 24 (2001) 244. • I.E. Anderson, J.C. Foley, B.A. Cook, J.L. Harringa, Lead-Free Electronic Solders, (2007) 39-54. • W.K. Choi, S.W. Hoi, D.-Y. Shih, D.W. Henderson, T. Gosselin, A. Sarkhel, C. Goldsmith, and K.J Yoon, H.M. Lee, Mater. Trans., 42 (2001) 783. • S.-K. Seo, M.G. Cho, W.K. Choi, H.M. Lee, J. Electron. Mater., 35 (2006) 1975. • D.H. Kim, M.G. Cho, S.-K. Seo, H.M. Lee, J. Electron. Mater., 38 (2009) 39. • M.G. Cho, S.K. Kang, D.Y. Shih, H.M. Lee, J. Electron. Mater., 36 (2007) 1501. • S.K. Kang, M.G. Cho, D.Y. Shih, S.-K. Seo, and H.M. Lee, Proc. 58th Electronic Components and Technology Conf. (Piscataway NJ: IEEE. 2008), pp. 478. • S.-K. Seo, M.G. Cho and H.M. Lee, J. Electron. Mater., 36 (2007) 1536. • M. Abtew, G. Selvaduray, Mater. Sci. Eng. 27 (2000) 95–141. • C.M.L. Wu, D.Q. Yu, C.M.T. Law, L. Wang, Mater. Sci. Eng. R, 44 (2004) 1–44. • K. Zeng, K.N. Tu, Mater. Sci. Eng. R, 38 (2002) 55–105. • S. Knott, H. Flandorfer, A. Mikula, Z. Metallkd., 96 (2005) 38–44. • E. Çadırlı, M. Gündüz, J. Mater. Proceess. Tech., 97 (2000) 74. • E. Çadırlı, U. Böyük, H. Kaya, N. Maraşlı, K. Keşlioğlu, S. Akbulut, Y. Ocak, J. Alloy. Compd., 470 (2009) 150. • U. Böyük, N. Maraşlı, H. Kaya, E. Çadırlı, K. Keşlioğlu, Appl. Phys. A-Mater., 95 (2009) 923. • C. Wei, Y.C. Liu, Y.J. Han, J.B. Wan, K. Yang, J. Alloy. Compd., 464 (2008) 301–305 • H. Ohtani, M. Miyashita, K. Ishida, J. Jpn. Instrum. Methods., 63 (1999) 685–694. • I. Ohnuma, M. Miyashita, X.J. Liu, H. Ohtani, K. Ishida, IEEE Trans. Electron. Packag. Manuf., Vol. 26, 2003. • J. Shen, Y.C. Liu, H.X. Gao, J. Electron. Mater., 34 (2005) 1591–1597. • U. Böyük, N. Maraşlı, J. Alloy. Compd., 485 (2009) 264-269 • Ourdjini, J. Liu and R. Elliott, Mater. Sci. Tech-Lond., 10 (1994) 312. 3. Result and Discussions 3.1. Effect of growth rate on the eutectic spacing As expected, the formations of the microstructures have varied with the growth rates and temperature gradient. As the growth rate and temperature gradient are increased, the eutectic spacing decreases. Variation of versus Vis essentially linear on the logarithmic scale. It can be seen from Fig. 4, the data form straight lines, the linear regression analysis gives the proportionality equation as, where k is a constant and n is an exponent value of growth rate. The relationships between the eutectic spacing and growth rates were determined as by using linear regression analysis. It is apparent that the exponent value of growth rate (0.53) is close to 0.50 predicted by Jackson-Hunt eutectic theory [19]. b 1 mm Figure 1