Download
1 / 28
290 likes | 437 Vues
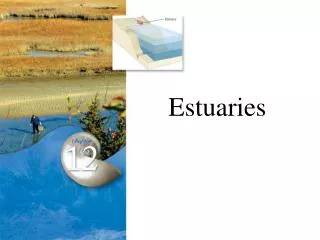
Monitoring programmes: the fundamental component of estuaries management. How to design one?. Coastal Engineering 2005 Seventh International Conference on Modelling, Measurements, Engineering and Management of Seas and Coastal Regions 13 - 15 April 2005 Algarve, Portugal.

E N D
Monitoring programmes: the fundamental component of estuaries management. How to design one? Coastal Engineering 2005 Seventh International Conference on Modelling, Measurements, Engineering and Management of Seas and Coastal Regions13 - 15 April 2005Algarve, Portugal L. M. Nunes1, S. Caeiro2, T. Ramos1, M. C.Cunha3, L. Ribeiro4 & M. H. Costa5 1Faculty of Marine and Environmental Sciences, University of Algarve, Faro, Portugal, CVRM. 2Distance Learning University, Lisboa, Portugal. 3Department of Civil Engineering, University of Coimbra, Coimbra, Portugal. 4CVRM, Technical University of Lisbon, Lisboa, Portugal 5IMAR, Faculty of Sciences and Technology, New University of Lisbon, Lisbon, Portugal.
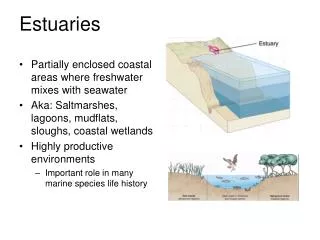
Objectives • Build a conceptual framework to design and assess environmental estuarine monitoring programmes and networks, to detect quality status changes in coastal areas within environmental management programmes; • In this context compare two alternative monitoring network design methods (variance-reduction and space-filling) Coastal Engineering 200513 - 15 April 2005Algarve, Portugal
Introduction • Two common types of information used in environmental management are i) baseline information that measures the environmental conditions and status of resources before a project is commenced and ii) monitoring information that measure the changes, if any, that occurred after the project was built and operated; • The statistical reliability of the sampling strategy and parameters is a key factor; • Technical design of monitoring networks is related to the determination of: i) monitoring sites; ii) monitoring frequencies; iii) variables to be sampled; iv) duration of sampling. Coastal Engineering 200513 - 15 April 2005Algarve, Portugal
Introduction • Monitoring programmes should be designed to contribute to a synthesis of information or to evaluate impacts, or analyse the complex cross-linkages between environmental quality aspects, impacts and socio-economic driving forces • Indicators should be included in monitoring programs to estimate trend, stressor source and magnitude of effects and lead to thresholds for management or restoration action • To assure that indicators serve the purpose for which they are intended and control the way they are specifically selected and developed, it is important to organize them in a consistent framework Coastal Engineering 200513 - 15 April 2005Algarve, Portugal
Methods: INDICAMP framework • An adaptation of INDICAMP – conceptual framework to design and assess environmental estuarine monitoring programs – is proposed; • INDICAMP was initially developed for the post-decision monitoring programs within Environmental Impact Assessment (EIA) processes; • The framework is based on a rearrangement of frameworks like PSR/E, DPSIR and ISO 14031; • The implementation of INDICAMP therefore requires the definition of a set of indicators aimed at the different parts of the framework: pressures, state, effects, responses and monitoring performance. Coastal Engineering 200513 - 15 April 2005Algarve, Portugal
META-LEVEL MONITORING Estuary Human Activities Activity Performance Monitoring performance MONITORING PROGRAM Monitoring Networks e.g. Variance reduction methods Space-filling methods Responses Management authorities / society Pressures on the environment Effects State of the environment Monitoring indicators Actions-decisions
Methods: INDICAMP framework • This framework tries to incorporate systems analysis approach, designing the main cause-effect relationships between the different categories of monitoring indicators; • The framework also shows that the performance of the monitoring program can be evaluated at one main stage, meta-level monitoring: • Monitoring performance indicators category represents the effort to conduct and implement the program, measuring also program effectiveness; • The definition of the monitoring network and the methods to accomplish it should be part of the INDICAMP framework. Coastal Engineering 200513 - 15 April 2005Algarve, Portugal
Monitoring network design • Reliability of monitoring networks means that they must reproduce the correct values (precision) with the lowest variance (accuracy), and reproduce the spatial and temporal variability of the parameters under study; • Usually, the reliability of a monitoring network increases with the number of stations and changes with their relative position in space; AND Optimisation of a monitoring network is a problem of choosing the best locations for the monitoring stations (some small number, say, ), given all the available possible locations, Coastal Engineering 200513 - 15 April 2005Algarve, Portugal
Monitoring network design • The outcome is a combinatorial problem for which the number of possible solutions, M, is calculated by the combinatorial formula: M = !/((-)! !). Even for small values of and the number of combinations attains very large numbers; • The reliability of a monitoring network has to be evaluated in some way such that the low quality designs are discarded and the good ones are selected; • Evaluation must beautomated because manual evaluation is impossible in reasonable amounts of time This calls for a fast algorithm Simulated annealing was used here Coastal Engineering 200513 - 15 April 2005Algarve, Portugal
Monitoring network design • Two objective functions were tested: • Variance reduction (minimisation of the kriging variance), leading to highest spatial accuracy; • Space-filling method (minimisation of a metric), leading to designs that fill the space. Coastal Engineering 200513 - 15 April 2005Algarve, Portugal
Monitoring network design • Variance reduction • sound statistical approach that requires a large data set, geostatistical background, and is very time consuming to implement. • need prior georrefenced data, descriptive statistical analysis, and the modelling of spatial auto-covariance functions (or, given some stationarity requirements, the variogram) And At the heart of geostatistical variance reduction method used here lies the estimation error variance obtained by kriging with the method of leave-one-out Coastal Engineering 200513 - 15 April 2005Algarve, Portugal
select or discard the solution according to SA algorithm Monitoring network design If termination Show solution • Variance reduction choose kriging variances mean kriging variance swap one station between the small and large sets If not termination Note: Ordinary kriging equations are not shown because they are very well-known Coastal Engineering 200513 - 15 April 2005Algarve, Portugal
Monitoring network design • Space-filling method • In space-filling designs some criterion based on a metric is used to evaluate the goodness of a space covering design; • variation of random allocation that requires no prior data, no statistical background, and is fast to implement; Coastal Engineering 200513 - 15 April 2005Algarve, Portugal
1 æ ö q q = ç ÷ å C ( D ) d ( x , D ) p , q p è ø Î u C 1 æ ö p p = - ç ÷ å d ( x , D ) x u p è ø Î u D Monitoring network design • Space-filling method • The most common criteria are those that use the following criterion: which is an average of distances between candidate stations and the design. The exponent q is usually >0. One possible metric is where when p<0, dp(x,D)0 as x converges to a member of D Note: The coverage design is the subset of elements in D from the elements in C, DC, that minimize the criterion Cp,q(D). Coastal Engineering 200513 - 15 April 2005Algarve, Portugal
select or discard the solution according to SA algorithm Monitoring network design • Space-filling method If termination Show solution choose Calculate Cp,q (D) swap one station between the small and large sets If not termination Coastal Engineering 200513 - 15 April 2005Algarve, Portugal
Example case-study • Sado estuary • The second largest in Portugal, with an area of approximately 24,000 ha; • Most of the estuary is included in the classification of Nature Reserve ; • Has, in part of its northern shores, some industries and harbours, and the city of Setúbal. Further inshore there are some mining activity, intensive farming, mostly rice fields. In the intertidal area there are also traditional saltpans and increasingly intensive fish farms. Coastal Engineering 200513 - 15 April 2005Algarve, Portugal
Example case-study • Sado estuary • An environmental data management system was already developed for the estuary area, being now under development the implementation of an indicator framework to design and assess an environmental program, presented here, being the monitoring one of its most important components. Coastal Engineering 200513 - 15 April 2005Algarve, Portugal
Example case-study • Sado estuary • In a first extensive campaign 153 sediment locations were sampled and fine fraction (FF), organic matter (OM), and redox potential (Eh), chosen as indicators of sediment propertiesunder the INDICAMP framework; • A systematic unalignedsampling design with a grid size equal to 0.365 km2 was used based on prior information on the spatial variation of sediment granulometry. Coastal Engineering 200513 - 15 April 2005Algarve, Portugal
Example case-study • Sado estuary • The extensive campaign was used for the delimitation of homogeneous areas within which estuarine state and effects could be monitored using less locations. These areas are also used as physical spatial components in the management system. These results were published elsewhere. Coastal Engineering 200513 - 15 April 2005Algarve, Portugal
Example case-study Sado Estuary sediment extensive sampling design and sediment classes Coastal Engineering 200513 - 15 April 2005Algarve, Portugal
Results • A cost analysis was made considering: i) linear distance between sampling stations; ii) constant boat velocity of 12,8 km/h; iii) 7 h of daily working period ; iv) a fixed time for sampling of 20 min; v) boat rent costs of 250 € per day; vi) 500 € for the chemical analysis per contaminant (discount of 25 % from 20 to 50 stations, 30 % from 55 a 100 stations and 40 % from 105 to 130 stations). • Once selected the appropriate indicators of state and effects, the location of monitoring stations were determined for fourteen different monitoring network sizes (ω): {25,30,35,40,45,50,60,70,80, 90,100,110,120,130}; Coastal Engineering 200513 - 15 April 2005Algarve, Portugal
1.2 50000 L e g e n d 130 25 125 Kriging variance 120 Cost 100 30 115 35 1 40000 95 110 105 90 85 ) function s o 80 r 40 u 75 E 0.8 30000 ( 70 t s 45 65 o Objective C 50 60 55 50 60 70 45 80 0.6 20000 90 100 110 120 130 40 35 30 25 20 0.4 10000 20 40 60 80 100 120 140 N u m b e r o f s t a t i o n s Results • Figure shows the resulting gains in monitoring accuracy, as measured by the variance reduction method and total costs of monitoring for different sizes of the monitoring design. • It was decided that a design with 77 stations should be chosen in order to guarantee the placement of stations near important pollutant sources. Coastal Engineering 200513 - 15 April 2005Algarve, Portugal
173000 172000 171000 170000 169000 168000 167000 166000 165000 164000 130000 133000 136000 139000 142000 145000 148000 Results • The two monitoring network design methods were applied to the 77 stations selected in the previous step: Legend: Original stations (+) variance reduction (o) space-filling () UTM coordinates in metres Coastal Engineering 200513 - 15 April 2005Algarve, Portugal
173000 172000 171000 170000 169000 168000 167000 166000 165000 164000 130000 133000 136000 139000 142000 145000 148000 Results • Interpolated absolute error of estimation with the variance reduction method: Mean absolute error of estimation: 0.584 Mean estimation error variance: 0.798 Coastal Engineering 200513 - 15 April 2005Algarve, Portugal
Results • Interpolated absolute error of estimation with the space-filling method: Mean absolute error of estimation: 0.922 Mean estimation error variance: 1.381 173000 172000 171000 170000 169000 168000 167000 166000 165000 164000 130000 133000 136000 139000 142000 145000 148000 Coastal Engineering 200513 - 15 April 2005Algarve, Portugal
Results • variance reduction method outperforms the space-filling method in terms of precision. The rate between the second and first absolute estimation errors is 0.63, representing an average gain in precision of 63%; • variance reduction method outperforms space-filling in terms of accuracy: the mean estimation error variance is 1.381 for space-filling and 0.798 for variance reduction. The rate between the second and first estimation error variances is 0.58, representing an average gain in accuracy of 58%. Coastal Engineering 200513 - 15 April 2005Algarve, Portugal
Conclusions • The work presented serves to pinpoint some drawbacks of fast, but less reliable, methods for monitoring network design, as compared to more time-consuming, but more robust methodologies. • The problem still to be solved in management programmes is the amount of resources allocated to each task, conditioning the choice for the amount of effort put in the design of data collection programs. • The results presented here may help in the decision-making process by indicating the amount of gain/loss expected when choosing one method over another. Coastal Engineering 200513 - 15 April 2005Algarve, Portugal
Conclusions • Though these results clearly show that more evolved methods may give better results in terms of monitoring network designs reliability (perform better), it should be noticed that in many instances the amount of data available may make impossible to obtain the necessary statistical information required for variance reduction methods. • In this cases the reliability of the monitoring network will approximate that of a random-based one, such as those obtained with space-filling. This work may serve as an indication of how far from the quality of the latter one may be. Coastal Engineering 200513 - 15 April 2005Algarve, Portugal