Download
1 / 16
160 likes | 315 Vues
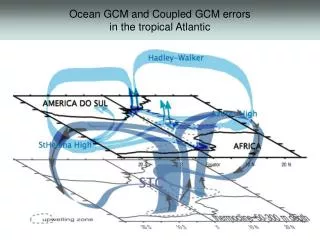
Boundary and Initial Flow Induced Variability in CCC-GCM. Amir Shabbar and Kaz Higuchi Climate Research Branch Environment Canada. Introduction.

E N D
Boundary and Initial Flow Induced Variability in CCC-GCM Amir Shabbar and Kaz Higuchi Climate Research Branch Environment Canada 29th Climate Diagnostic and Prediction Workshop
Introduction • ENSO-forced SST boundary conditions and extreme initial flow atmospheric configurations are analyzed for variability over the PNA sector in a series of Canadian atmospheric GCM experiments • Two-way ANOVA and EOF techniques are used to assess and quantify the effects of prescribed boundary conditions and initial (zonal and meridional) flow regimes on the modes of mid-latitude variability 29th Climate Diagnostic and Prediction Workshop
Questions • Does the extreme phase of flow configuration excite some known mode of variability? • Are the effects of ENSO SSTs and internal atmospheric dynamics on the total variability independent? 29th Climate Diagnostic and Prediction Workshop
Experimental Design Partition the total variation of 500 hPa heights into two statistically independent components that isolate the variability forced by (a) the prescribed ENSO SSTs and sea-ice extents, and (b) the variability associated with the changes in the initial flow configuration (i.e., zonal or meridional over the Pacific-North American sector). ANOVA partitions the total sum of squares SSTOT into four components SSTOT = SSSST + SSFLOW + SSSxF + SSINTER SSSST is the between sum of squares that measures differences between the warm and cold phases of ENSO SSFLOW is the between sum of squares that measures differences between the two initial flow configuration. SSSxF is the between sum of squares that measures the interaction between the boundary forcing and initial flow configuration effects SSINTER is the sum of squares from internal sources that remains after the effects of boundary forcing, initial conditions and interaction terms are taken into account. The total number of degrees of freedom dfTOT is given by dfTOT = dfSST + dfFLOW+ dfSxW + dfINTER 29th Climate Diagnostic and Prediction Workshop
Hypothesis Testing for Boundary and Initial Conditions • The null hypotheses for the three effects are set as follows: a) Hsst: μC1 = μC2 El Niño and La Niña has no effect on the 500 hPa response. b) Hflow: μR1 = μR2 Zonal or meridional flow configuration has no effect on the 500 hPa response. c) Hsxf: (μ11 - μ12) = (μ21 - μ22) ENSO response is not influenced by the initial flow configuration. 29th Climate Diagnostic and Prediction Workshop
El Niño- La Niña SST Composites 29th Climate Diagnostic and Prediction Workshop
Mean 500 hPa Flow for Initial Condition Average of first 10 days of November are examined for zonal and meridional flow regimes 29th Climate Diagnostic and Prediction Workshop
Model and Observed Variability in 500 hPa Circulation for ENSO Years Overall, the amplitude of the wintertime variability in the ENSO simulations are attenuated compared to those found in the observed data 29th Climate Diagnostic and Prediction Workshop
Zonal and Meridional Initial Flow 29th Climate Diagnostic and Prediction Workshop
Ratio of Boundary-forced variance to total variance over PNA sector CCC-GCM results show that specified SSTs and sea-ice boundary conditions induce significant amount of mid-latitude Variability in both seasonal and monthly means, the pattern of which resembles the PNA teleconnection 29th Climate Diagnostic and Prediction Workshop
Ratio of Initial-forced variance to total variance over PNA sector A PNA-like pattern can be identified in December (b), and the pattern takes a more classical PNA appearance in January (c) 29th Climate Diagnostic and Prediction Workshop
Difference between Zonal and Meridional Flow The relationship between the zonal and meridional flow in the model is further analyzed by forming differences in the mean of 10-member zonal and 10-member meridional flow regimes. The January pattern shown is very similar to the PNA. The nature of air-sea interaction in the North Pacific may lead to this pattern. 29th Climate Diagnostic and Prediction Workshop
Pattern Correlation between five-sample and three-sample variance • The PNA pattern remains identifiable when the signal to noise ratio is reduced in the smaller ensemble of 3 sample. • Shown are the pattern correlation between the original 5-member sample and 100 3-member sample. The results are strong for December (a) and January (b), but become weaker in February (c) 29th Climate Diagnostic and Prediction Workshop
First Two EOFs of Dec-Feb 500 hPa Heights as derived from model ensemble 29th Climate Diagnostic and Prediction Workshop
Boundary and Initial Flow F- Ratio in EOF reconstructed 500 hPa Heights Dec-Feb F-ratio in reconstructed data shows PNA-like pattern for both Boundary and Initial flow effects 29th Climate Diagnostic and Prediction Workshop
Summary • Two way ANOVA on model ensemble shows that the specified time varying SSTs in the tropical Pacific contribute significantly to the North American variability as a PNA mode of circulation • Moreover, initial flow configuration induces additional variability over the region through the PNA-like mode of variability • Relative contribution from the tropical SSTs and the initial flow are linearly independent and additive • ANOVA technique applied to 500 hPa anomaly filtered with the leading two EOFs shows considerable boundary-forced and to a lesser extent initial flow variability over the Pacific North American sector 29th Climate Diagnostic and Prediction Workshop