Download
1 / 9
90 likes | 168 Vues
How to Read Topographic Maps BAE 3313 Natural Resources Engineering Source http://www.cis.ksu.edu/~dha5446/topoweb/guide.html. How is a Watershed?. The total land area that contributes water to a stream, river or lake. Source: http://www.epa.gov/owow/watershed/whatis.html.

E N D
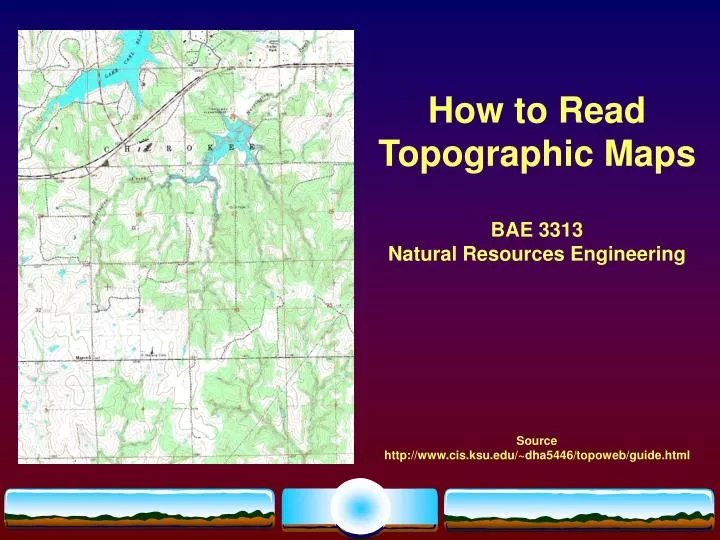
How to Read Topographic Maps BAE 3313 Natural Resources Engineering Source http://www.cis.ksu.edu/~dha5446/topoweb/guide.html
How is a Watershed? The total land area that contributes water to a stream, river or lake. Source: http://www.epa.gov/owow/watershed/whatis.html
What is a Topographic Map? • Shows elevation data for a small piece of the earth • Shows physical and manmade features • U.S. Geological Survey (USGS) is the primary distributor of topographic maps • 7.5 minute maps, 1:24,000 scale • Complete US coverage also available for 1:100,000 and 1:250,000 • Amount of detail shown on a map is proportional to the map scale • 1:24,000 - high detail • 1:100,000 - moderate detail • 1:250,000 - low detail
1:24,000 Topographic Map • Covers 7.5 minutes of latitude by 7.5 minutes of longitude • Approximately equal to 8 miles north-south and 6 miles east-west • One map called a quadrangle or “quad” • 28 inches long by 21 inches wide • Purchase from USGS or most outdoor stores
Cultural and Physical Symbols Forest: Shown in green Unforested: White; May be grass, soil, or some other surface Roads: Two parallel lines; Unbroken lines indicate paved roads, broken lines unpaved Trails: Dashed lines Streams and Rivers: Thin lines for streams, large blue area for larger rivers Lake: Solid blue area Marshy Area: Blue symbols enclosed by blue dashed line Buildings: Building shapes shown, may be filled or unfilled UTM Grid Lines: Especially useful for GPS, each grid square is 1 km x 1 km
Contours • Contour lines are continuous brown lines. Each line represents a specific elevation, and all locations along that line have the exact same elevation. • "Contour Interval 20 Feet" means that the elevation change between contour lines is 20 feet. • Contour lines close together have a large amount of elevation change. • Darker contour lines are Index and labeled contour. • An ‘X’ marks a spot elevation.
Contours - Slopes • How can you tell which side of the hill slope is highest? • Look at the contour lines ‘A’ and ‘B’ • ‘A’ is at elevation 7500 ft; ‘B’ is at elevation 7600 ft. • Traveling along line ‘C’ would be uphill; 100 ft elevation change. • Slope = Rise/Run
Contours - Direction of Flow • Water travels down gradient. • When contour lines identify a stream, they form a ‘V’ shape. • The ‘V’ always points upstream.
Contours – Hill Tops • Contour circle at ‘H’ shows that the land inside the circle is higher than the surrounding area. • ‘F’ and ‘K’ are also high points. • Exception: At ‘I’ there are tiny tick marks that point to the inside of the circular shape. This is a depression with no outlet.