Download
1 / 72
740 likes | 1.03k Vues
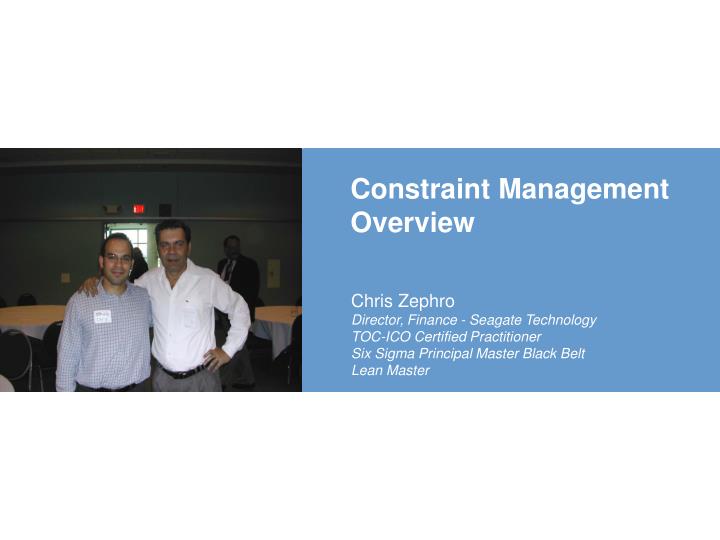
Constraint Management Overview. Chris Zephro Director, Finance - Seagate Technology TOC-ICO Certified Practitioner Six Sigma Principal Master Black Belt Lean Master. System Complexity. Which system is more complex?. What is the Systems Approach?.

E N D
Constraint Management Overview Chris Zephro Director, Finance - Seagate Technology TOC-ICO Certified Practitioner Six Sigma Principal Master Black Belt Lean Master
System Complexity Which system is more complex?
What is the Systems Approach? • Originally proposed by Dr. W. Edwards Deming • Holistic thinking • The whole is not the sum of its parts. • Interaction-interdependencies-among components are as important, or more important, than the performance of the components themselves • The whole system can’t be managed effectively by suboptimizing. • Avoid Suboptimization. • Not all components are created equal. • Some may accept inefficiencies so that more critical components can succeed.
The “Archimedes Point” “Give me a lever long enough and a place to stand, and I can move the world.”
What is Constraint Management? • Constraint Management is a system-level management philosophy developed by Dr. Eliyahu Goldratt that can be viewed as three separate but interrelated areas: • Performance Measurements: Throughput Decision Support and the Five Focusing Steps • Logistics: Drum-Buffer-Rope Production Scheduling and Buffer Management. • Logical Thinking: Logical Thinking Process (Current Reality Tree, Future Reality Tree, Conflict Resolution Diagram, Prerequisite Tree and Transition Tree) • Project Management: Critical Chain Project Management
Assumptions Underlying Constraint Management • Every system has a goal and a set of necessary conditions that must be satisfied in order to maximize achievement of the goal. • All systems are subject to logical cause-and-effect. • Organizations live or die as integrated systems, NOT as a collection of discrete, independent processes. • Systems are analogous to chains. • The performance of a system is limited by very few links at any given time, usually only one. • The global organization is greater than the sum of its parts. • The way to improve company performance (global optimum) is NOT through achieving local improvements (local optimum) everywhere. • Constraints can never really be eliminated – they just move to a different place.
The Manufacturing Chain #1 (2) 57% #3 (1) 71% #4 (1) 32% #5 (1) 36% #2 (1) 19% #7 (2) 42% #6 (1) 41% Machine Capacity Utilization (Monthly) Which is likely to be the weakest link (system limitation)?
The Manufacturing Chain(Expanded) External Service Marketing & Sales CUSTOMER Supplier #1 #1 #2 #3 #4 #5 #6 #7 Distribution Production Supplier #2 The chain really extends from the market demand, through the entire organization chain, to the external customer who pays for our products
Constraint Management Fundamentals The Five Focusing Steps
The Five Focusing Steps of Constraint Management • Identify the System’s Constraints. • Decide how to Exploit the System’s Constraints. • Subordinate everything else to the above decision. • Elevate the System’s Constraints. • If in the previous steps a Constraint has been broken, go back to Step 1.
Step 1 - Identify the System’s Constraints • What limits the system performance now? • Is it inside the system (a resource or policy) or is it outside the system (the market, material supply, a vendor . . . or another policy)? • When looking at a process, where is the one point people always have to go to expedite?
What is a Constraint? Anything that limits a system in reaching its goal. Types of Constraints: • Market – Not enough demand for a product or service. • Resource – Not enough people, equipment, or facilities. • Material – Inability to obtain required material. • Supplier/Vendor – Unreliability of a supplier or vendor, or excessive lead time in responding to orders. • Financial – Insufficient cash flow to sustain an operation. • Knowledge/Competence – Information or knowledge to improve business performance is not resident within the system or organization. • Policy – Any law, regulation, rule, or business practice that inhibits progress toward the system’s goal.
Examples of Policy Constraints • “We will not approve new projects if the projected IRR is less than 20% in three years.” • Reason given for not pursuing new technology development. • “If we can’t manufacture a component for less than we can buy it, we will outsource that component.” • International Harvester policy in the 3 years before bankruptcy. • “We are a metal-stamping company.” • Reason given for not investing in laser-cutting technology. • “We can not add components that will increase BOM cost or negatively impact gross margins.” • Policy that makes decisions blind to impact at the system constraint. And the most common one of all . . . • “We strive for efficiency everywhere.”
Other Constraints • Material • Unavailable • Slow • Vendor / Supplier • Unreliable • Slow • Financial • Cash Flow • Knowledge / Competence • Lack of expertise, knowledge • Lack of competent skills
Step 2 - Decide how to Exploit the System’s Constraints • Exploit means to get the most out of the constraining element without additional investment. • Change the way you operate so that the maximum financial benefit is achieved from the constraining element. • Understand the sales mix that maximizes the Capacity Constrained Resource (CCR) or identified Capacity Point. • Throughput Decision Support using Throughput per CCR Hour. Exploit: Use; develop; make use of; take advantage of; make the most of.
Step 3 - Subordinate everything else to the above decision • All parts of the system that are NOT constraints are required to do whatever they can to SUPPORT the plan to EXPLOIT decided on in step 2. • All non-constraints must NOT DO ANYTHING that would HURT the exploitation plan for the constraint. • Non-constraints (most of the system) recognize that THEIR OWN EFFICIENCY is not as important as supporting the system constraint.
Step 4 - Elevate the System’s Constraints • Evaluate alternative ways to ELEVATE one or more constraints. • Predict where the future constraint will be (after elevation) and its impact on the global performance. • Mentally apply the first three steps to each alternative • Where will the constraint go NEXT, and how difficult will it be to manage it THERE? • Select the best alternative to elevate the constraint. Elevate: To physically raise or increase the capacity to flow work through a resource or system component; acquisition of, or investment in, more resources.
Step 5 - The Five Focusing Steps • Go back to step one. Beware of inertia in identifying constraints. • The actual new constraint may be different from what was expected.
Red Curve & Green Curve • Repeated application of the Five Focusing Steps • Successive constraints broken $$$ Improvement • Cost reductions (efficiency target) • Single iteration of the Five Focusing Steps (inertia) Time
Constraint Management Evaluating Operating Decisions
Evaluating Operating DecisionsThe Traditional Approach • The financial standard for most decisions is profit • A decision that produces higher profit is GOOD. • A decision that produces lower profit is BAD. • Three key financial measures to evaluate the correctness of a decision . . . . • Net Profit (NP) • Cash Flow (CF) • Return on Investment (ROI)
Evaluating Operating DecisionsThe Traditional Approach • NP and ROI are very difficult concepts to apply to day-to-day decisions. • Effects of a decision on NP and ROI not easily quantifiable in financial terms. • How to determine the global (company-wide) financial impact of local (departmental) decisions? • Constraint theory provides a bridge between local operating decisions and global financial well-being . . .
Evaluating Operating DecisionsThe Constraint Management Approach • Throughput (T) • Investment (I) • Operating Expense (OE) These measures are predicated on the assumption that the organization's goal is to make more money, now and in the future.
Throughput (T) • The rate at which the organization generates “goal units.” • In a for profit organization, “goal units” equals money (i.e. incremental cash flows) through sales. New money coming into (and retained by) the system. • Sales minus Truly Variable Costs (TVC), where TVC is the costs that vary directly with the number of units sold, usually just materials. • Measured and assessed at the unit, product and organizational level.
Throughput Hierarchy • Company Level • Marginal contribution to profit of ALL sales in ALL product lines. • Sales revenue – Variable Cost of all Sales • Product Level • Marginal contribution to profit of ALL sales in ONE product lines. • Sales revenue – Variable Cost of all Sales • Unit Level • Marginal contribution to profit of ONE UNIT of product. • Unit Selling price – Unit Variable Cost
Investment (I) • All the money the system invests in assets and materials that are used to produce the products or services the system intends to sell. • Capital Assets • Facilities • Equipment • Stock of finished goods • Receivables
Operating Expense (OE) • All the money the organization spends in generating “goal units / Throughput.” The money flowing out of the system. • Normally, most categories of overhead (fixed expenses) • The money the organization constantly pays, even if production were to stop for a while. • Salaries • Rent • Insurance • Depreciation
$$$ Investment $$$ Throughput $$$ Operating Expense T, I & OE Flow (System) Money Tied Up Inside the System Money Coming In Money Going Out
Relation of T, I and OE to Traditional Business Measures of Merit • Net Profit = T-OE • Return on Investment = (ΔT-ΔOE)/ΔI • Productivity = T/OE • Investment Turns = T/I The profit from any decision is ΔT NOTΔOE • The system constraint limits the level of Throughput that can be achieved. • Operating Expense is generated primarily by non-constraints.
Thinking Bridge Example Demand = 3,500 Drives Price = $400 each Raw Material = $80/Drive Employee Wage = $18/hr Number of Employees = 4 (1/workstation) Each Employee Works 2,080 hrs/year (40 hrs/week, 52 weeks/year) Other Expenses = $900,000 Drive Manufacturing Process:
Scenario 1 • An Engineer proposes buying a new fixture to reduce total processing time by 3 minutes. • The new fixture would allow some work to be transferred from workstation 101 to 102. Proposed Change:
Scenario 1 – Cost Savings per Drive IRR = 400%, Payback Period < 3 Months Is this proposal an improvement?
Scenario 1 – Global Measurements Thinking Bridge Analysis • When using the global measurements (T, I, & OE) technique for the financial analysis of a proposed expenditure, we need to ask 5 questions: • What prevents the firm from increasing throughput? • Will the total amount of throughput change? • Will the operating expenses of the firm change? • Will the amount of investment of the firm change? • What is the real economic effect of the proposal?
Scenario 1 – The Five Questions • What prevents the firm from increasing Throughput? • Note: This question does not arise in least product cost thinking bridge. • Strategic Control Point is 102, however the company could produce 4,622 drives/yr. (124,800 min. / 27 min. of 102) & demand is 3,500 drives. • Will the total amount of Throughput change? • No, the engineer’s proposal has no effect on volume of sales, neither sales revenue or variable cost (raw materials). • Will the Operating Expenses of the firm change? • Do we have the same number of employees? • Has our overhead changed? • No, these all remain the same
Scenario 1 – The Five Questions • Will the amount of Investment of the firm change? • Investment increases by $5,000 • What is the real economic effect of the proposal?
Scenario 2 • Everything is the same as in scenario 1, except the firm is currently producing and selling at its capacity of 4,992 units. • The engineer makes the same proposal.
Scenario 2 – Cost Savings per Unit IRR = 630%, Payback Period about 2 Months Is this proposal an improvement?
Scenario 2 – The Five Questions • What prevents the firm from increasing throughput? • Strategic Control Point (Capacity Constrained Resource) is 102. • The proposal increases the time required at workstation 102 from 25 minutes to 27 minutes. • The company can only produce 4,622 drives/yr. (124,800 mins. / 27 min of 102) & demand is 4,992 drives.
Scenario 2 – The Five Questions • Will the total amount of throughput change?
Scenario 2 – The Five Questions • Will the operating expenses of the firm change? • No, these all remain the same • 4. Will the amount of investment of the firm change? • Investment increases by $5,000
Scenario 2 – The Five Questions • 5. What is the real economic effect of the proposal?
Scenario 3 • Let’s start with the original case. • Demand is 6,000 drives. • The firm is currently operating at a level of 4,992 drives. • The plant engineer makes a similar suggestion, but this time the effect is to increase the time required to produce the product by 3 minutes. • 5 minutes is added to workstation 101’s processing time. • The processing time of 102 is decreased by 2 minutes.