Download
1 / 11
110 likes | 354 Vues
Care New England Health System Statement of Operations Month of April 2013. Variance Actual Budget Fav/(Unfav) Total Revenue $ 73,343,523 $ 72,935,597 $ 407,926

E N D
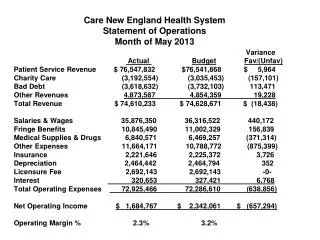
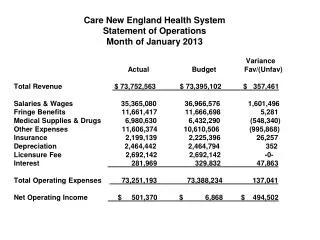
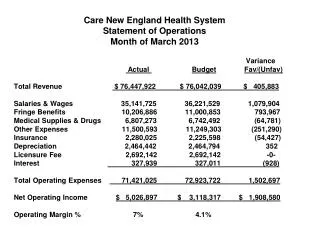
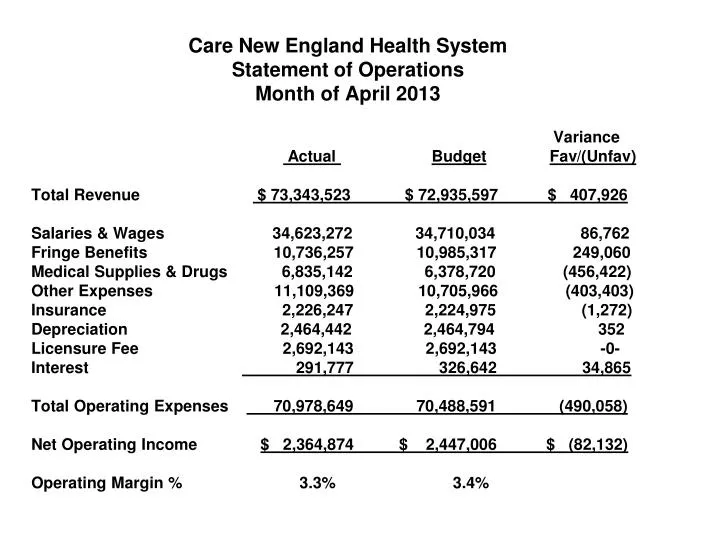
Care New England Health SystemStatement of OperationsMonth of April 2013 Variance Actual BudgetFav/(Unfav) Total Revenue $ 73,343,523 $ 72,935,597 $ 407,926 Salaries & Wages 34,623,272 34,710,034 86,762 Fringe Benefits 10,736,257 10,985,317 249,060 Medical Supplies & Drugs 6,835,142 6,378,720 (456,422) Other Expenses 11,109,369 10,705,966 (403,403) Insurance 2,226,247 2,224,975 (1,272) Depreciation 2,464,442 2,464,794 352 Licensure Fee 2,692,143 2,692,143 -0- Interest 291,777 326,642 34,865 Total Operating Expenses 70,978,649 70,488,591 (490,058) Net Operating Income $ 2,364,874 $ 2,447,006 $ (82,132) Operating Margin % 3.3% 3.4%
Care New England Health SystemStatement of OperationsYear-To-Date Fiscal Year 2013 Variance Actual Budget Fav/(Unfav) YTDYTDYTD Total Revenue $ 500,973,790 $ 503,522,373 $ (2,548,583) Salaries & Wages 245,673,543 250,942,939 5,269,396 Fringe Benefits 74,016,198 76,390,787 2,374,589 Medical Supplies & Drugs 45,879,816 44,498,318 (1,381,498) Other Expenses 78,656,348 77,126,703 (1,529,645) Insurance 15,514,613 15,574,190 59,577 Depreciation 17,232,432 17,253,554 21,122 Licensure Fee 18,844,998 18,844,998 -0- Interest 2,040,767 2,199,777 159,010 Total Operating Expenses 497,858,715 502,831,266 4,972,551 Net Operating Income $ 3,115,075 $ 691,107 $ 2,423,968 Operating Margin % 0.6% 0.1%
Women & Infants CorporationControllable ExpensesFor the Month of April 2013 Variance ActualBudgetFav/(Unfav) Total Net Revenue $ 37,808,147$ 36,904,620$ 903,527 Salaries 15,646,197 15,512,782 (133,415) Medical Supplies 1,860,843 1,683,696 (177,147) Drugs 1,210,953 1,151,995 (58,958) Other Expenses: Consulting 120,295 165,422 45,127 Non-Medical Supplies 109,927 110,057 130 Purchased Services 1,587,064 1,657,362 70,298 Maintenance Contracts 131,765 149,069 17,304 Repairs & Maintenance 133,137 135,901 2,764 Food Costs 83,050 91,752 8,702 Rent Equipment 76,319 61,764 14,555 Dues & Subscriptions 93,560 105,865 12,305 Travel & Education 107,532 125,336 17,804
Fiscal Year 2013 MetricsMonth of April 2013 CNE (excludes VNA)Women & Infants April April Variance April April Variance ActualBudgetFav/(Unfav) ActualBudgetFav/(Unfav) Cost Per Adjusted Day $2,310 $2,346 1.51% $ 2,717 $ 2,863 5.11% Cost Per Adjusted D/C $11,646 $11,647 0.01% $10,946 $11,368 3.71% FTE’s Per Adj Occp Bed 4.83 4.87 0.79% 5.58 5.60 0.26% Salary Per FTE $ 77,570 $ 78,846 1.62% $81,563 $ 85,610 4.73% Total Cost Per FTE $101,714 $103,936 2.14% $ 107,613 $113,516 5.20% OT as a % of Paid dollars 3.7% / 3.6% 2.8% / 2.8% Last Month 3.9% / 3.9% 3.9% / 3.9%
Women & Infants CorporationControllable ExpensesFiscal Year-to-Date as of April 2013 Variance ActualBudgetFav/(Unfav) Total Revenue $ 259,255,093 $ 254,878,507 $ 4,376,586 Salaries 111,898,386 115,229,794 3,331,408 Medical Supplies 12,520,101 11,745,673 (774,428) Drugs 8,622,905 7,990,747 (632,158) Other Expenses: Consulting 844,405 1,157,954 313,549 Non-Medical Supplies 721,147 694,234 (26,913) Purchased Services 11,320,189 11,591,910 271,721 Maintenance Contracts 1,029,414 960,520 (68,894) Repairs & Maintenance 952,528 911,257 (41,271) Food Costs 568,132 605,155 37,023 Rent Equipment 581,140 522,484 (58,656) Dues & Subscriptions 606,853 838,563 231,710 Travel & Education 545,190 758,385 213,195
Fiscal Year 2013 MetricsFiscal Year-to-Date April 2013 CNE (excludes VNA) Women & Infants April April Variance April April Variance ActualBudgetFav/(Unfav) ActualBudget Fav/(Unfav Cost Per Adjusted Day $2,356 $ 2,407 2.11% $ 2,868 $ 2,975 3.61% Cost Per Adjusted D/C $ 11,936 $ 11,964 0.24% $11,445 $11,819 3.17% FTE’s Per Adj Occp Bed 4.86 5.03 3.39% 5.56 5.87 5.21% Salary Per FTE $ 80,180 $ 80,391 0.26% $87,136 $ 87,970 0.95% Total Cost Per FTE $ 104,416 $ 104,933 0.49% $ 114,778 $ 115,805 0.89% OT as a % of Paid dollars 5.7% / 4.4% 5.1% / 3.7% Last month YTD 6.0% / 4.5% 5.5% / 3.9%