Download
1 / 11
110 likes | 337 Vues
Care New England Health System Statement of Operations Month of May 2013. Variance Actual Budget Fav/(Unfav) Patient Service Revenue $ 76,547,832 $76,541,868 $ 5,964 Charity Care (3,192,554) (3,035,453) (157,101)

E N D
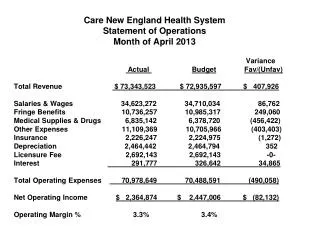
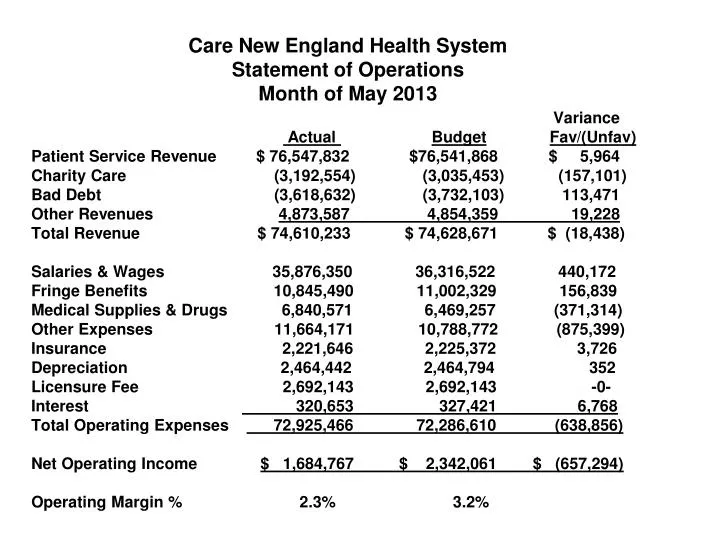
Care New England Health SystemStatement of OperationsMonth of May 2013 Variance Actual BudgetFav/(Unfav) Patient Service Revenue $ 76,547,832 $76,541,868 $ 5,964 Charity Care (3,192,554) (3,035,453) (157,101) Bad Debt (3,618,632) (3,732,103) 113,471 Other Revenues 4,873,587 4,854,359 19,228 Total Revenue $ 74,610,233 $ 74,628,671 $ (18,438) Salaries & Wages 35,876,350 36,316,522 440,172 Fringe Benefits 10,845,490 11,002,329 156,839 Medical Supplies & Drugs 6,840,571 6,469,257 (371,314) Other Expenses 11,664,171 10,788,772 (875,399) Insurance 2,221,646 2,225,372 3,726 Depreciation 2,464,442 2,464,794 352 Licensure Fee 2,692,143 2,692,143 -0- Interest 320,653 327,421 6,768 Total Operating Expenses 72,925,466 72,286,610 (638,856) Net Operating Income $ 1,684,767 $ 2,342,061 $ (657,294) Operating Margin % 2.3% 3.2%
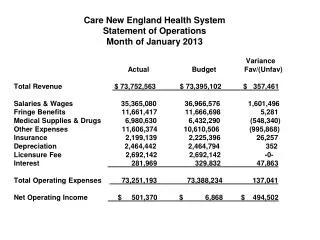
Care New England Health SystemStatement of OperationsYear-To-Date Fiscal Year 2013 Variance Actual Budget Fav/(Unfav) YTDYTDYTD Patient Service Revenue $593,186,024 $593,101,508 $ 84,516 Charity Care (25,862,848) (23,720,713) (2,142,135) Bad Debt (30,648,119) (29,278,354) (1,369,765) Other Revenues 38,908,965 38,048,602 860,363 Total Revenue $ 575,584,022 $578,151,043 $ (2,567,021) Salaries & Wages 281,549,893 287,259,460 5,709,567 Fringe Benefits 84,861,690 87,393,116 2,531,426 Medical Supplies & Drugs 52,720,386 50,967,576 (1,752,810) Other Expenses 90,320,516 87,915,473 (2,405,043) Insurance 17,736,259 17,799,561 63,302 Depreciation 19,696,873 19,718,348 21,475 Licensure Fee 21,537,141 21,537,141 -0- Interest 2,361,420 2,527,198 165,778 Total Operating Expenses 570,784,178 575,117,873 4,333,695 Net Operating Income $ 4,799,844 $ 3,033,170 $ 1,766,674 Operating Margin % 0.8% 0.5%
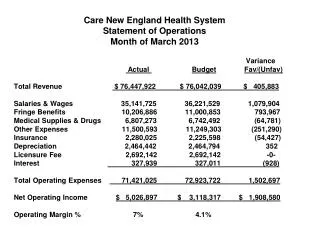
Women & Infants CorporationControllable ExpensesFor the Month of May 2013 Variance ActualBudgetFav/(Unfav) Salaries 16,130,883 16,351,864 220,981 Medical Supplies 1,773,632 1,748,454 (25,178) Drugs 1,208,114 1,185,193 (22,921) Other Expenses: Consulting 141,902 165,422 23,520 Non-Medical Supplies 93,454 95,480 2,026 Purchased Services 1,502,898 1,657,432 154,534 Maintenance Contracts 114,640 121,560 6,920 Repairs & Maintenance 110,941 116,745 5,804 Food Costs 107,459 102,666 (4,793) Rent Equipment 86,631 89,951 3,320 Dues & Subscriptions 29,471 95,321 65,850 Travel & Education 106,845 130,636 23,791
Fiscal Year 2013 MetricsMonth of May 2013 CNE (excludes VNA)Women & Infants May May Variance May May Variance ActualBudgetFav/(Unfav) ActualBudgetFav/(Unfav) Cost Per Adjusted Day $2,358 $2,352 (0.28)% $ 2,673 $ 2,829 5.54% Cost Per Adjusted D/C $11,584 $11,666 0.70% $10,467 $11,250 6.96% FTE’s Per Adj Occp Bed 5.16 5.12 (0.79)% 6.06 6.11 0.79% Salary Per FTE $ 77,738 $ 79,425 2.12% $77,856 $ 82,301 5.40% Total Cost Per FTE $101,283 $103,578 2.22% $ 102,301 $108,025 5.30% OT as a % of Paid dollars 5.5% / 4.3% 3.7%/ 2.5% Last Month3.7% / 3.6% 2.8% / 2.8%
Women & Infants CorporationControllable ExpensesFiscal Year-to-Date as of May 2013 Variance ActualBudgetFav/(Unfav) Salaries 128,029,269 131,581,658 3,552,389 Medical Supplies 14,293,733 13,494,129 (799,604) Drugs 9,831,020 9,175,940 (655,080) Other Expenses: Consulting 986,307 1,323,376 337,069 Non-Medical Supplies 814,601 789,713 (24,888) Purchased Services 12,823,087 13,249,342 426,255 Maintenance Contracts 1,144,053 1,082,080 (61,973) Repairs & Maintenance 1,063,469 1,028,002 (35,467) Food Costs 675,591 707,821 32,230 Rent Equipment 667,771 612,435 (55,336) Dues & Subscriptions 636,324 933,885 297,561 Travel & Education 652,035 889,021 236,986
Fiscal Year 2013 MetricsFiscal Year-to-Date May 2013 CNE (excludes VNA) Women & Infants May May Variance May May Variance ActualBudgetFav/(Unfav) ActualBudget Fav/(Unfav Cost Per Adjusted Day $2,356 $ 2,400 1.81% $ 2,842 $ 2,956 3.87% Cost Per Adjusted D/C $ 11,891 $ 11,926 0.30% $11,313 $11,745 3.68% FTE’s Per Adj Occp Bed 4.86 5.00 2.81% 5.53 5.79 4.50% Salary Per FTE $ 80,456 $ 80,909 0.56% $87,345 $ 88,850 1.69% Total Cost Per FTE $ 104,782 $ 105,596 0.77% $ 115,018 $ 116,921 1.63% OT as a % of Paid dollars 5.5% / 4.3% 5.0% / 3.6% Last month YTD 5.7% / 4.4% 5.1% / 3.7%