Download
1 / 12
120 likes | 345 Vues
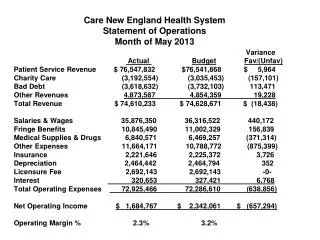
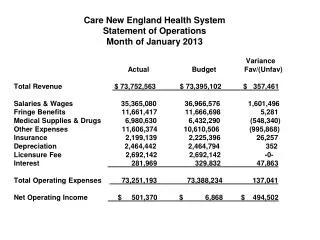
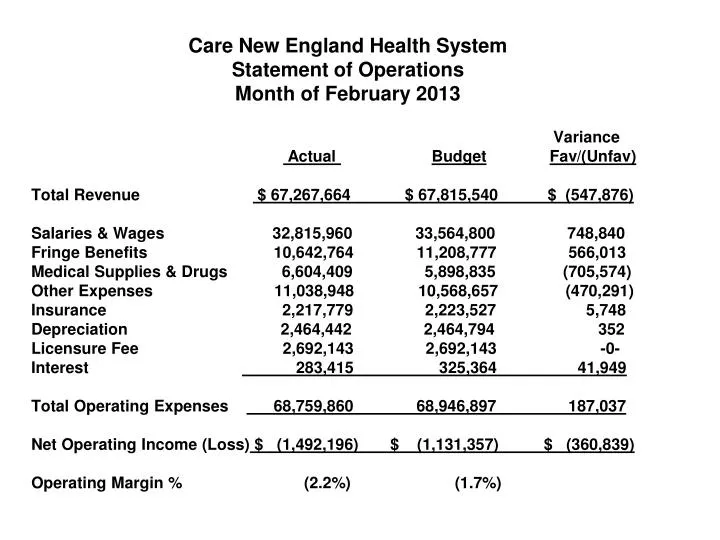
Care New England Health System Statement of Operations Month of February 2013. Variance Actual Budget Fav/(Unfav) Total Revenue $ 67,267,664 $ 67,815,540 $ (547,876)

E N D
Care New England Health SystemStatement of OperationsMonth of February 2013 Variance Actual BudgetFav/(Unfav) Total Revenue $ 67,267,664 $ 67,815,540 $ (547,876) Salaries & Wages 32,815,960 33,564,800 748,840 Fringe Benefits 10,642,764 11,208,777 566,013 Medical Supplies & Drugs 6,604,409 5,898,835 (705,574) Other Expenses 11,038,948 10,568,657 (470,291) Insurance 2,217,779 2,223,527 5,748 Depreciation 2,464,442 2,464,794 352 Licensure Fee 2,692,143 2,692,143 -0- Interest 283,415 325,364 41,949 Total Operating Expenses 68,759,860 68,946,897 187,037 Net Operating Income (Loss) $ (1,492,196) $ (1,131,357) $ (360,839) Operating Margin % (2.2%) (1.7%)
Care New England Health SystemStatement of OperationsYear-To-Date Fiscal Year 2013 Variance Actual Budget Fav/(Unfav) YTDYTDYTD Total Revenue $ 351,182,346 $ 354,544,738 $ (3,362,392) Salaries & Wages 175,908,546 180,011,376 4,102,830 Fringe Benefits 53,073,054 54,404,617 1,331,563 Medical Supplies & Drugs 32,237,401 31,377,105 (860,296) Other Expenses 56,046,385 55,171,431 (874,954) Insurance 11,008,343 11,123,617 115,274 Depreciation 12,303,548 12,323,967 20,419 Licensure Fee 13,460,713 13,460,713 -0- Interest 1,421,051 1,546,124 125,073 Total Operating Expenses 355,459,041 359,418,950 3,959,909 Net Operating Income $ (4,276,695) $ (4,874,212) $ 597,517 Operating Margin % (1.2%) (1.4%)
Women & Infants CorporationControllable ExpensesFor the Month of February 2013 Variance ActualBudgetFav/(Unfav) Total Net Revenue $ 34,600,024$ 34,395,004$ 205,020 Salaries 14,940,062 15,405,615 465,553 Medical Supplies 1,762,631 1,557,140 (205,491) Drugs 1,346,078 1,071,006 (275,072) Other Expenses: Consulting 118,000 165,422 47,422 Non-Medical Supplies 115,764 85,652 (30,112) Purchased Services 1,577,031 1,657,905 80,874 Maintenance Contracts 214,304 208,159 (6,145) Repairs & Maintenance 135,603 101,497 (34,106) Food Costs 67,474 75,853 8,379 Rent Equipment 81,645 78,021 (3,624) Dues & Subscriptions 72,539 127,063 54,524 Travel & Education 49,880 91,655 41,775
Fiscal Year 2013 MetricsMonth of February 2013 CNE (excludes VNA)Women & Infants February February Variance Februrary February Variance ActualBudgetFav/(Unfav) ActualBudgetFav/(Unfav) Cost Per Adjusted Day $2,505 $2,553 1.9% $ 3,264 $ 3,268 0.1% Cost Per Adjusted D/C $13,171 $12,733 (3.5%) $12,950 $12,983 0.3% FTE’s Per Adj Occp Bed 4.71 4.95 5.0% 5.45 5.76 5.3% Salary Per FTE $ 75,508 $ 76,316 1.1% $82,759 $ 84,071 1.6% Total Cost Per FTE $100,030 $101,894 1.8% $ 110,556 $112,492 1.7% OT as a % of Paid dollars 6.5% / 4.6% 5.8% / 3.8%
Women & Infants CorporationControllable ExpensesFiscal Year-to-Date as of February 2013 Variance ActualBudgetFav/(Unfav) Total Revenue $ 179,701,161 $ 179,251,155 $ 450,006 Salaries 80,315,158 83,140,491 2,825,333 Medical Supplies 8,761,928 8,278,699 (483,229) Drugs 6,193,417 5,617,601 (575,816) Other Expenses: Consulting 590,636 827,110 236,474 Non-Medical Supplies 489,018 466,493 22,525) Purchased Services 8,129,058 8,275,186 146,128 Maintenance Contracts 764,466 673,322 (91,144) Repairs & Maintenance 632,484 583,543 (48,941) Food Costs 404,402 430,708 26,306 Rent Equipment 424,673 381,247 (43,426) Dues & Subscriptions 453,173 632,956 179,783 Travel & Education 326,992 510,528 183,536
Fiscal Year 2013 MetricsFiscal Year-to-Date February 2013 CNE (excludes VNA) Women & Infants February February Variance February February Variance ActualBudgetFav/(Unfav) ActualBudget Fav/(Unfav Cost Per Adjusted Day $2,367 $ 2,437 2.9% $ 2,924 $ 3,031 3.5% Cost Per Adjusted D/C $ 12,011 $ 12,121 0.9% $11,683 $12,039 3.0% FTE’s Per Adj Occp Bed 4.89 5.11 4.3% 5.66 6.03 5.9% Salary Per FTE $ 80,103 $ 80,239 0.2% $87,041 $ 87,571 0.6% Total Cost Per FTE $ 104,342 $ 104,548 0.2% $ 114,702 $ 115,244 0.5% OT as a % of Paid dollars 6.5% / 4.9% 5.4% / 3.8% BLIZZARD NEMO RESULTED IN $100,000 UNEXPECTED OVERTIME. Total overtime for entire month was $136,000 unfavorable to budget.