Download
1 / 36
370 likes | 1.08k Vues
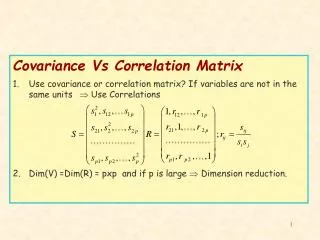
Techniques for studying correlation and covariance structure. Principal Components Analysis (PCA) Factor Analysis. Principal Component Analysis. Let. have a p -variate Normal distribution. with mean vector. Then. where. are eigenvectors of S of length 1 and. are eigenvalues of S.

E N D
Techniques for studying correlation and covariance structure Principal Components Analysis (PCA) Factor Analysis
Let have a p-variate Normal distribution with mean vector Then where are eigenvectors of S of length 1 and are eigenvalues of S.
The Principal Components are defined by or and have covariance matrix are independent with Var(Cj) = lj
Many times for large value of j,Var(Cj) = lj, is small and contributes little to the total variance In this case the number of variables can be reduced to the small number of principal components. In regression analysis it is sometimes useful to transform the independent variables into their principal components
Scree Plot Proportion of variance Principal Components
Scree Plot Cumulative Proportion of variance Principal Components
Example In this example wildlife (moose) population density was measured over time (once a year) in three areas.
picture Area 3 Area 2 Area 1
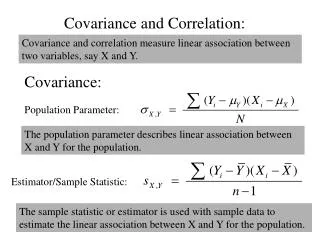
The Sample Statistics The mean vector The covariance matrix The correlation matrix
Principal component Analysis The eigenvalues of S The eigenvectors of S The principal components
Recall: Computation of the eigenvalues and eigenvectors of S
continuing we see that: For large values of n
The algorithm for computing the eigenvector • Compute rescaling so that the elements do not become to large in value. i.e. rescale so that the largest element is 1. • Compute using the fact that: • Compute l1 using
Repeat using the matrix • Continue with i = 2 , … , p – 1 using the matrix Example – Using Excel - Eigen
Factor Analysis An Alternative technique for studying correlation and covariance structure
Let have a p-variate Normal distribution with mean vector The Factor Analysis Model: Let F1, F2, … , Fk denote independent standard normal observations (the Factors) Let e1, e2, … , ep denote independent normal random variables with mean 0 and var(ei) = yp Suppose that there exists constants lij (the loadings) such that: x1= l11F1+ l12F2+ … + l1kFk + e1 x2= l21F1+ l22F2+ … + l2kFk + e2 … xp= lp1F1+ lp2F2+ … + lpkFk + ep
Using matrix notation where and with
Note: hence and i.e. the component of variance of xi that is due to the common factors F1, F2, … , Fk. i.e. the component of variance of xi that is specific only to that observation.
Determine cov(xi,Fj) Recall
Also where Thus Now , if also then lij is the correlation between xi and Fj.
Rotating Factors Recall the factor Analysis model This gives rise to the vector having covariance matrix: Let P be any orthogonal matrix, then and
Hence if with is a Factor Analysis model then so also is with where P is any orthogonal matrix.
The process of exploring other models through orthogonal transformations of the factors is called rotating the factors There are many techniques for rotating the factors • VARIMAX • Quartimax • Equimax VARIMAX rotation attempts to have each individual variables load high on a subset of the factors
Example: Olympic decathlon Scores Data was collected for n = 160 starts (139 athletes) for the ten decathlon events (100-m run, Long Jump, Shot Put, High Jump, 400-m run, 110-m hurdles, Discus, Pole Vault, Javelin, 1500-m run). The sample correlation matrix is given on the next slide