Download
1 / 23
240 likes | 454 Vues
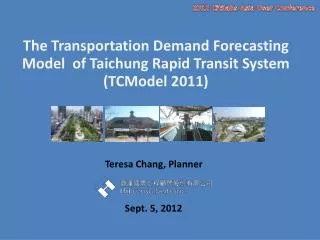
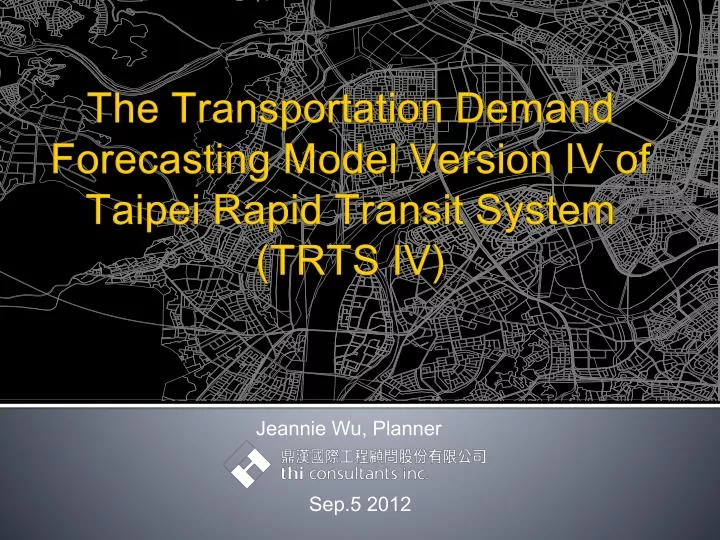
Jeannie Wu, Planner. The Transportation Demand Forecasting Model Version IV of Taipei Rapid Transit System (TRTS IV). Sep.5 2012. Outline. Background Model Review Model Function Model Structure Transportation System Model Interface Model Output GIS Display. Background-Study Area.

E N D
Jeannie Wu, Planner The Transportation Demand Forecasting Model Version IV of Taipei Rapid Transit System(TRTS IV) Sep.5 2012
Outline • Background • Model Review • Model Function • Model Structure • Transportation System • Model Interface • Model Output • GIS Display
Background-Study Area New Taipei City (29) Taipei (12) Guishan Town(1) • Study Area -- Taipei Urban • County: Taipei、NewTaipei&Gishan Town • Town:42 • Area:2398.45 KM2 • Population:6.71million people
Backgound-Taipei MRT • Taipei Mass Rapid Transit System(refers to Taipei MRT) • the First & the LargestMRT System in Taiwan • 108 Station • Legth:116.8km
Taipei Model Review • TRTSI, II • Aggregate Sequential Travel Demand Model • Software: Transport(Highway) & Tranplan(PT) • TRTS III • Aggregate Sequential Travel Demand Model • Software: Transport & Tranplan • Main for passenger transportation system, for the MRT planning • DOTS-I,II • Base on TRTS III ,Data Update • Software: Transport & Tranplan, Access 97 (DOTS-II Database), ArcView(for GIS Display) • TRTS-I • TRTS-II • TRTS-III • TRTS-IV • DOTS-I • DOTS-II 1981 • 1987 • 1994 year • 1997 • 2001 2011~2012 • Upgrade software and display system Update Data
Model Function Long-term transport planning Transportation Demand Analysis, Policy evaluation Provide meso and micro analysis software integration interface Small regional network analysis, intersection signal, centriod line • Extension Interface • Economic benefits、Energy consumption • Combined with GIS & Database • Transit DataBase,GIS Display Friendly User Interface Development of the Windows operating interface, enhance friendly User Interface Model Function
Model Structure • Four Main Model • Socio-Economic Prediction model─estimated future year Socio-Economic Data • Supply Model-Compute the Initial skim and parameter for Demand Model • Demand Model-the main model of TRTS IV, with four transportation planning step. • Sub-Demand Model – AM/PM/Non-Peak Analysis • Peak Sperading Model- AM/PMPeak Hour Analysis • Daily Demand Model- Sum of All Sub-Demand Model • Evaluation Parameter Model- compute some economic paramter like VTT, VKT 1 2 3 4
Model Structure-Demand model • Production : category analysis • Attraction : regression analysis Four StepModel with feedback • Gravity Model • Impedance Function:Gamma Function Two-iteration Average GC Cost Trip Generation Trip Distribution Two-iteration Average Mode Skim • Multinomial Logit Model • Nested Logit Model (Private & PT) Mode Choice OutBound & Cargo Trips/PCU • HW:Multi-Modal Equilibrium Assignment Model • PT: Best-Path Trip Assignment Convergence Check Modal Share, Average Trip Length
Tranportation system-Highway Network • Node:11398 • Link: 29134 • Traffic Analysis Zones: • Internal:571 zones • External:30Zones • Total number of zones: 601zones • Analytical Highway Modes • Motorcycle • Car • Taxi • Bus(PCU) • Truck • Tourbus
Tranportation system-Public Transit System Year: 2021 215 MRTStatioins Legth:238.2km Base year-2009 87 MRTStatioins Legth:91.8km Year: 2012 108 MRTStatioins Legth:116.8km Year: 2031 266 MRTStatioins Legth:296km Year: 2015 160 MRTStatioins Legth:195.2km OtherMode: 40 RailStation 652 Busline(city bus & Long-distance bus)
Model Interface-Main Model Demand Model NonPeak AMPeak PMPeak Demand Model-2 Traffic Assigment Trip Generation Outbound l Trip Distribution Cargo Matrix trasfer AMPeakHour PMPeakHour Main Window Convergence test Mode Choice SociaEconomic Prediction Model Evaluation Model Demand Model Supply Model
Model Interface- Senario Interface Scenario 1 (S1) ─ Base Situation Analysis Year ─ 2009 (Y98), 2012(Y101), 2015(Y104), 2021(Y110), 025(Y114), 2030(Y119), 2031(Y120), 2041(Y130) Scenario 2 (S2) ─ Intergrated Fare Analysis Year ─2021(Y110), 2031(Y120), 2041(Y130) Scenario 3 (S3) ─ Private Cost addition Analysis Year ─2021(Y110), 2031(Y120), 2041(Y130)
Model Interface- Data & MDBinterface MDB window Data window
Model Outputs & Benefit • Estimate benefit of MRT Construction • MRT Scheduling • MRT Route Planning • Bus Route Modification • Estimate benefit of Highway Construction • New Road construction • Increase car lane • Evaluate the policy • Parking fee Inceasment • Output items • travel demand (trips) • trip lengths • Modal shares • travel speeds(Vehicle Kilometers traveled (VKMT)/Vehicle hours traveled (VHT)) • Link Traffic Flow • Peak& PeakHour MRT flow(by line)
Model Outputs-Highway Assignment Result Traffic flow Bandwidth V/C Ratio Isochrome Analysis Speed
Model Outputs-Public Transit Assignment Result Passenger flow Bandwidth ON/OFF Anlysis
Model Outputs-Modal share(S1) 22.5% PT:Bus+Rail 22.1% 24.7% 28.2% 29.5% 31.1% 31.1% 32.2%
Model Outputs-Modal share(S2&S3) 2021 2031 2041 29.0% (+0.8%) 28.2% 27.5% (-0.7%) 32.8% (+1.7%) 31.1% 30.4% (-0.7%) 35.5% (+3.3%) 32.2% 31.7% (-0.5%) PT:Bus+Rail (S2) Integrated fare will reduce the PT mode share (S3) Private Cost addition will increase the PT mode share
The End~ Thanks for attending E-mail: cycleviki@ms1.thi.com.tw