Download

1 / 64
640 likes | 802 Vues
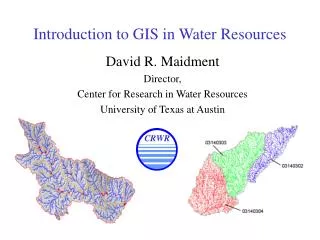
GIS in Environmental and Water Resources Engineering . Research Progress Report Jan 15, 1999. Texas data and water modeling: Hudgens, Mason, Davis Jonsdottir, Gu, Azagra, Niazi Environmental Risk Assessment: Hay-Wilson, Romanek, Kim. Global runoff: Asante, Lear

E N D
GIS in Environmental and Water Resources Engineering Research Progress Report Jan 15, 1999
Texas data and water modeling: Hudgens, Mason, Davis Jonsdottir, Gu, Azagra, Niazi Environmental Risk Assessment: Hay-Wilson, Romanek, Kim Global runoff: Asante, Lear Nonpoint source pollution: Melancon, Osborne Flood hydrology and hydraulics: Ahrens, Perales, Tate Internet: Favazza,Wei Research Areas
Texas data and water modeling: Hudgens, Mason, Davis Jonsdottir, Gu, Azagra, Niazi Environmental Risk Assessment: Hay-Wilson, Romanek, Kim Global runoff: Asante, Lear Nonpoint source pollution: Melancon, Osborne Flood hydrology and hydraulics: Ahrens, Bigelow, Perales, Tate Internet: Favazza,Wei Research Areas
Brad Hudgens Geospatial Data Development for Water Availability Modeling
Determining Watershed Properties • Need to know at many points on a stream network: the upstream drainage area, average precipitation and SCS CN value, and the downstream flow length • Grids of these variables are computed using the flow accumulation function • An attribute table is obtained using the Combine function
Weighted Flow Accumulation AvgCN=flowaccumulation(fdr, CN)+CN flowaccumulation(fdr)+1
Combine Grids GRID : “combine”
David Mason Geospatial Data Development for Water Availability Modeling
Control Point Status • FINALLY, Acquired all control points for Nueces and Guadalupe River basins • STILL, Waiting for control points on the San Antonio River basin
Meanwhile….. • Finished development of a single-line stream network for all basins • Attached control points with ID numbers to line network • Obtained more clearly defined project goals • Which watershed parameters are needed? • Worked on streamlining database development • Develop tools to automate the process
Trinity River TMDL Subtask on Network AnalystKim Davis
Jona Finndis Jonsdottir Geospatial Data for Total Maximum Daily Loads
New Tool Development for Water Modeling Richard Gu
Rainfall Runoff in the Guadalupe River Basin Esteban Azagra
Objectives • Run HEC-PrePro and HMS programs for a sample area. • Comparison of the runoff with field data. • Calibration of the modeling system.
What have I done? • Run HEC-PrePro and HMS. • Analysis of parameters. • Comparison of the model with field data
Analyzing Parameters • For Vx constant: D X = 20 % D flow @ 3.7 % • For X constant: D VX@ 20 % D flow @ 28 % • Use of Manning to change the values of VX
Comparison and Future work • Precipitation data used for HMS showed big differences between the model and the field data. • The use of NEXRAD Precipitation could help for a more detailed comparison.
Surface/Subsurface Modeling By: Shiva Niazi 1/15/99
Argus ONE Can create interface within software- inc. built-in functions Must manually create boundary, river arcs? GMS Supports more MODFLOW packages Time consuming Argus ONE vs. GMS
Texas data and water modeling: Hudgens, Mason, Davis Jonsdottir, Gu, Azagra, Niazi Environmental Risk Assessment: Hay-Wilson, Romanek, Kim Global runoff: Asante, Lear Nonpoint source pollution: Melancon, Osborne Flood hydrology and hydraulics: Ahrens, Bigelow, Perales, Tate Internet: Favazza,Wei Research Areas
Lesley Hay Wilson Spatial Environmental Risk Assessment
Current Research Status • Completed dissertation proposal defense on Dec 11th • Objective is to develop the spatial risk assessment methodology with emphasis on application to large, complex sites • Working on the site conceptual model and linkages between Access and ArcView
Risk Assessment Data Model Forward Risk Estimation Cross-media pathways Receptor Source Human, Ecological Geographic pathways Target Level Calculation
Research ApproachSpatial Site Conceptual Model • Spatial representations of the site conceptual model elements (e.g., sources, receptors) • Individual data layers for each element • Supported by • database of exposure pathway components • spreadsheet of transport and transfer algorithms • grid-based models • Implemented in a tiered approach
Connection of SCM Database and RBSL Spreadsheets Identify COC Pathway Segments Source Concentrations Excel Spreadsheet Perform simple fate and transport calculations ODBC Access Site Conceptual Model Database Link Pathway Endpoint Concentrations
Other Activities • Marcus Hook Project team meetings completed Jan 11-13th (team) • EWRE seminar presentation of dissertation proposal scheduled for Jan 20th
Andrew Romanek Surface Representation of the Marcus Hook Refinery
Activities • 3 day meeting with BP, Langan, UT, and others (Mon. - Wed.) • Update of progress • Delineation of future tasks • COC Transport Extension • Thesis
Surface water model extension to predict concentrations Steady state, conservative, mixing model (only decreases in concentration from additional flow) Initial attempt yielded a maximum benzene concentration of 0.26 mg/L COC Tranport Extension
Thesis • Intro to risk assessment and project • Digital Facility Description • Spatial and Tabular Databases • Data development (Photogrammetry) • Connection between Spatial and Tabular • Map-Based Modeling • Surface and Groundwater models
Spatial Analysis of Sources and Source Areas on Marcus Hook Progress report by Julie Kim Friday, November 20, 1998
Texas data and water modeling: Hudgens, Mason, Davis Jonsdottir, Gu, Azagra, Niazi Environmental Risk Assessment: Hay-Wilson, Romanek, Kim Global runoff: Asante, Lear Nonpoint source pollution: Melancon, Osborne Flood hydrology and hydraulics: Ahrens, Bigelow, Perales, Tate Internet: Favazza,Wei Research Areas
Global Runoff RoutingEstimating Flow Velocity Kwabena Asante
Methods • Lag Between Runoff Stations • Lag Between Rainfall and Runoff • Empirical Methods
Empirical Equations: Generally of the form: P = a * Q b Leopold and Maddock (1953): a = 1.3, b = 0.1 Matalas (1969): a = 1, b = 0.155
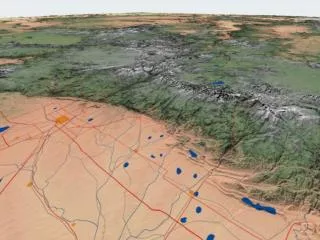
Grid Cell Translation from High to Low Resolution Mary Lear November 20, 1998
Texas data and water modeling: Hudgens, Mason, Davis Jonsdottir, Gu, Azagra, Niazi Environmental Risk Assessment: Hay-Wilson, Romanek, Kim Global runoff: Asante, Lear Nonpoint source pollution: Melancon, Osborne Flood hydrology and hydraulics: Ahrens, Bigelow, Perales, Tate Internet: Favazza,Wei Research Areas
Patrice Melancon Pollutant Loading Model for Tillamook Bay
Flow Contribution Distribution matches values reported for the watershed
Katherine Osborne Water Quality Master Planning for Austin
Texas data and water modeling: Hudgens, Mason, Davis Jonsdottir, Gu, Azagra, Niazi Environmental Risk Assessment: Hay-Wilson, Romanek, Kim Global runoff: Asante, Lear Nonpoint source pollution: Melancon, Osborne Flood hydrology and hydraulics: Ahrens, Bigelow, Perales, Tate Internet: Favazza,Wei Research Areas
Seth Ahrens Flood Forecasting in Houston
Rainfall Data: Benefits of MATLAB over Visual Basic Lat. Lon. Rf. Time (min) Rf. (mm) Program A Program B Time interval is inconsistent. Final output is an ArcView ASCII grid in the proper projection. All data in one grid in ten-minute intervals. Each time interval in own file. Benefits: Can now more efficiently prepare rainfall data. Original technique incorporated Visual Basic in Excel. Though it worked, the method proved to be cumbersome, error-prone (relied too much on user), and time-consuming.