Download
1 / 30
310 likes | 445 Vues
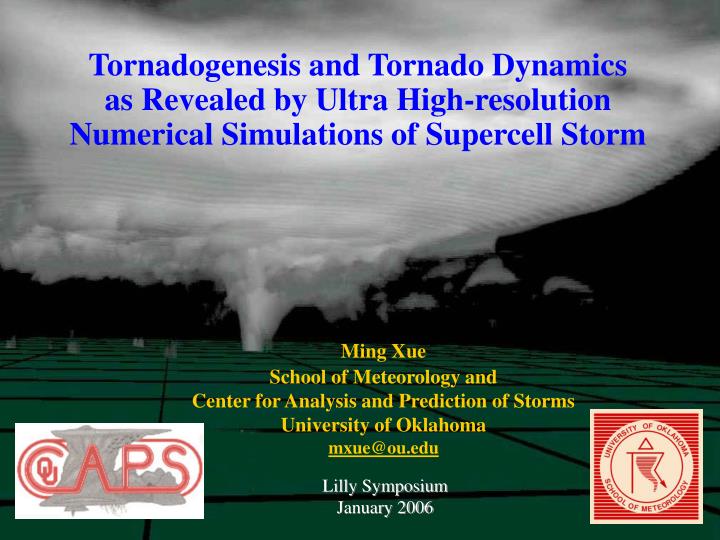
Tornadogenesis and Tornado Dynamics as Revealed by Ultra High-resolution Numerical Simulations of Supercell Storm. Ming Xue School of Meteorology and Center for Analysis and Prediction of Storms University of Oklahoma mxue@ou.edu. Lilly Symposium January 2006.

E N D
Tornadogenesis and Tornado Dynamics as Revealed by Ultra High-resolution Numerical Simulations of Supercell Storm Ming Xue School of Meteorology and Center for Analysis and Prediction of Storms University of Oklahoma mxue@ou.edu Lilly Symposium January 2006
Downward Transport of Mid-level Mesocyclone Angular Momentum by Rainy Downdraft (Davis-Jones 2001, 2002) vorticity carried by downdraft parcel baroclinic generation around cold, water loaded downdraft cross-stream vorticity generation by sfc friction
25 m resolution simulation • Using the ARPS model • 1977 Del City, OK sounding (~3300 J/kg CAPE) • 2000 x 2000 x 83 point uniform resolution 50 x 50 km grid. • Dx = 25 m, Dzmin = 20 m, dt=0.125 s. • Warmrain microphysics with surface friction at the later stage • Simulations up to 5 hours • Using 2048 Alpha Processors at Pittsburgh Supercomputing Center • 15TB of 16-bit compressed data generated by one 25m simulation over 30 minutes, output at 1 second intervals
Full Domain Surface Fields of 50m simulation t =3 h 44 min Red – positive vertical vorticity
Near surface vorticity, wind, reflectivity, and temperature perturbation 2 x 2 km Vort ~ 2 s-1
Maximum surface wind speed and minimum perturbation pressure of 25m simulation 120m/s >80mb pressure drop +50m/s in ~1min ~120m/s max surface winds -80mb 210min 240min
Movie of Cloud Water Field25 m, 7.5x7.5km domain, 30 minutes
z = 3 km t=13250s beginning of vortex intensification View from South
3km FFD of 2nd cell FFD of 1st cell Inflow from east Low-level jump flow View from Northeast
Summary • F5 intensity tornado formed behind the gust front, within the cold pool. • Air parcels feeding the tornado all originated from the warm sector in a layer of about 2 km deep. • The low-level parcels pass over the forward-flank gust front of 1st or 2nd supercell, descend to ground level and flow along the ground inside the cold pool towards the convergence center • The parcels gain streamwise vorticity through stretching and baroclinic vorticity generation (quantitative calculations to be completed) before turning sharply into the vertical
Summary – continued… • Intensification of mid-level mesocyclone lowers mid-level pressure • Upward vertical PGF draws initially negatively buoyant low-level air into the tornado vortex but the buoyancy turns positive as pressure drops • Intense vertical stretching follows intensification of low-level tornado vortex genesis of a tornado
Summary – continued. • Baroclinic generation of horizontal vorticity along forward-flank gust front does not seem to have played a key role in this case. • The relative role of downward transport of vertical vorticity associated with mid-level mesocyclone, as compared to streamwide vorticity in the parcel, needs further quantification. • Many issues remain.
Is resolution all it takes given a favorable supercell sounding? • No. • Tornado remained ≤ F2 when ice microphysics was used – cold pool was too strong! • There is a tremendous sensitivity to, e.g., the intercept parameters assumed for the hydrometeor drop-size distributions.
Large raindrops (r5) Maximum intensity: f2 Duration: 9 min. Vorticity Time Series from 100 m experiments 4 hours • Simulations favoring large hydrometeors (weak cold pools) were most favorable for development of long-lived tornadoes. • In simulations favoring small hydrometeors (strong cold pools), vortex spinups that did occur tended to be weak and short-lived.
Cold pool intensity (gray) N0r = 8 x 10⁵ m4, N0h = 4x10⁴ m4 N0r = 8 x 10⁷ m4, N0h = 4x10⁶ m4 large raindrops Small raindrops and hailstones Default of Lin scheme: N0r = 8x10⁶ m4, N0h = 4x10⁴ m4
Weaker cold pool case • Closeup of tornadic circulation in simulation favoring large raindrops (r5). • Maximum tornado intensity: f2 • Tornado duration: Approximately 9 min. • Location and development of tornado match well with theory and observations.
Prediction of the May 8, 2003 OKC Tornadic Supercell Storm • WSR-88D radar data assimilated very 5 min over 1 hour period • Full physics (sfc physics, turbulence, radiation, microphysics) model (ARPS) • 1 km analysis interpolated to 100 m grid
1-km grid forecast Reflectivity at 1.45º elevation 30-min forecast 40-min forecast
100 m grid prediction Surface Z in the northeastern part of the forecast domain during 2105-2227 UTC (over 22 minutes)
Surface fields from 2205-2215 UTCA tornado from 2210-2214 UTC Wind Reflectivity Maximum over 62 m s-1 Pressure Vorticity Minimum 919 hPa p’ ~ 40 mb Maximum0.66 s-1