Download
1 / 1
10 likes | 117 Vues
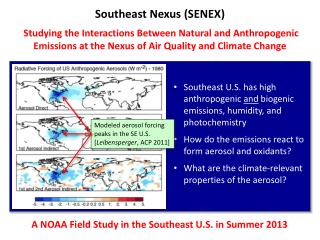
Ozone Observations at Huntsville during the 2013 SENEX and SEAC 4 RS Campaigns. SENEX. Air Quality and Climate in the Southeast US, A13A-0170.

E N D
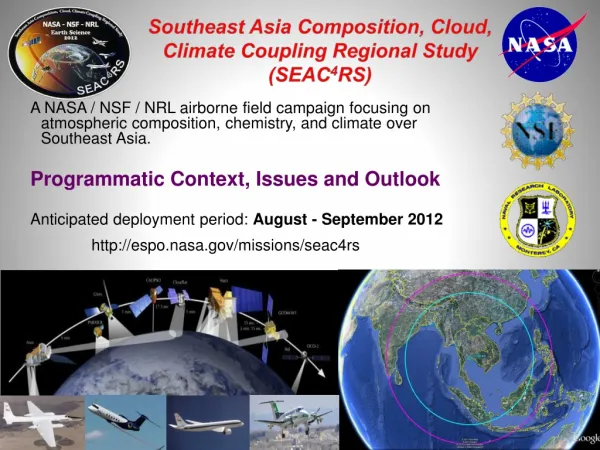
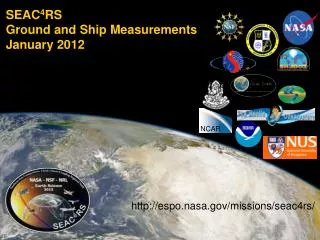
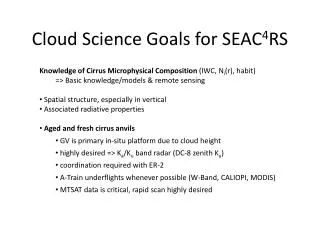
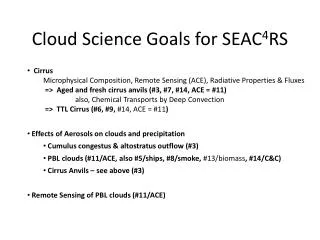
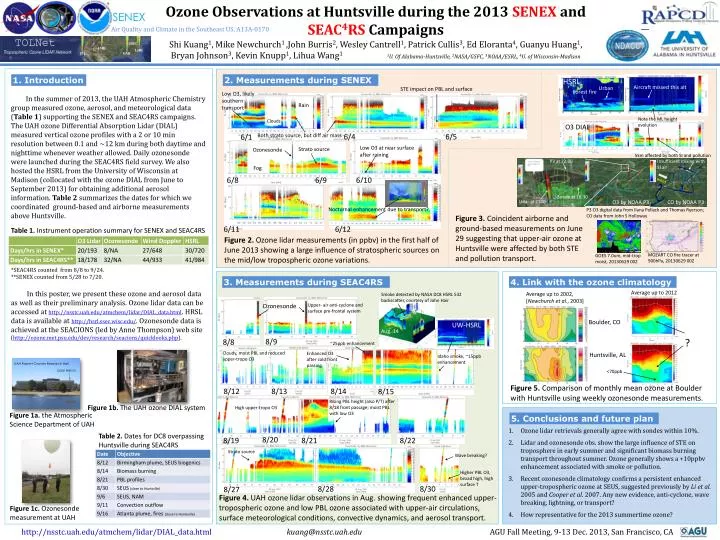
Ozone Observations at Huntsville during the 2013 SENEX and SEAC4RS Campaigns SENEX Air Quality and Climate in the Southeast US, A13A-0170 Shi Kuang1, Mike Newchurch1 ,John Burris2, Wesley Cantrell1, Patrick Cullis3, Ed Eloranta4, Guanyu Huang1, Bryan Johnson3, Kevin Knupp1, Lihua Wang11U. Of Alabama-Huntsville, 2NASA/GSFC, 3NOAA/ESRL, 4U. of Wisconsin-Madison TOLNet GSFC ESRL LaRC JPL UAH In the summer of 2013, the UAH Atmospheric Chemistry group measured ozone, aerosol, and meteorological data (Table 1) supporting the SENEX and SEAC4RS campaigns. The UAH ozone Differential Absorption Lidar (DIAL) measured vertical ozone profiles with a 2 or 10 min resolution between 0.1 and ~12 km during both daytime and nighttime whenever weather allowed. Daily ozonesonde were launched during the SEAC4RS field survey. We also hosted the HSRL from the University of Wisconsin at Madison (collocated with the ozone DIAL from June to September 2013) for obtaining additional aerosol information. Table 2 summarizes the dates for which we coordinated ground-based and airborne measurements above Huntsville. In this poster, we present these ozone and aerosol data as well as their preliminary analysis. Ozone lidar data can be accessed at http://nsstc.uah.edu/atmchem/lidar/DIAL_data.html. HRSL data is available at http://hsrl.ssec.wisc.edu/. Ozonesonde data is achieved at the SEACIONS (led by Anne Thompson) web site (http://ozone.met.psu.edu/dev/research/seacions/quicklooks.php). 1. Introduction 2. Measurements during SENEX HSRL Aircraft missed this alt. Urban. STE impact on PBL and surface Forest fire Low O3, likely southern transport Rain Note the ML height evolution Clouds O3 DIAL 6/4 6/5 Both strato source, but diff air mass 6/1 Low O3 at near surface after raining Strato source Ozonesonde 5km affected by both SI and pollution Insufficient mixing with SI air P3 at 22:00 Fog 6/10 6/9 6/8 wind Sonde at 18:30 Lidarat 2100 O3 by NOAA P3 CO by NOAA P3 Nocturnal enhancement due to transport? P3 O3 digital data from Ilana Pollack and Thomas Ryerson; CO data from John S Holloway Figure 3. Coincident airborne and ground-based measurements on June 29 suggesting that upper-air ozone at Huntsville were affected by both STE and pollution transport. 6/11 6/12 Table 1. Instrument operation summary for SENEX and SEAC4RS Figure 2. Ozone lidar measurements (in ppbv) in the first half of June 2013 showing a large influence of stratospheric sources on the mid/low tropospheric ozone variations. MOZART CO fire tracer at 900hPa, 20130629 00Z GOES 7.0um, mid-trop moist, 20130629 00Z *SEAC4RS counted from 8/8 to 9/24. **SENEX counted from 5/28 to 7/20. 3. Measurements during SEAC4RS 4. Link with the ozone climatology Average up to 2012 Average up to 2002, [Newchurch et al., 2003] Smoke detected by NASA DC8 HSRL 532 backscatter, courtesy of John Hair Ozonesonde Upper- air anti-cyclone and surface pre-frontal system Boulder, CO UW-HSRL Aug. 14 ? 8/9 8/8 ~25ppb enhancement Cloudy, moist PBL and reduced upper-tropo O3 Enhanced O3 after cold front passing Huntsville, AL Idaho smoke, ~15ppb enhancement UAH Robert Cramer Research Hall Lidar Hatch <70ppb Figure 5. Comparison of monthly mean ozone at Boulder with Huntsville using weekly ozonesonde measurements. 8/12 8/13 8/14 8/15 Rising PBL height (also P/T) after 8/18 front passage; moist PBL with low O3 Figure 1b. The UAH ozone DIAL system High upper-tropo O3 • Ozone lidar retrievals generally agree with sondes within 10%. • Lidar and ozonesonde obs. show the large influence of STE on troposphere in early summer and significant biomass burning transport throughout summer. Ozone generally shows a +10ppbv enhancement associated with smoke or pollution. • Recent ozonesonde climatology confirms a persistent enhanced upper-tropospheric ozone at SEUS, suggested previously by Li et al. 2005 and Cooper et al. 2007. Any new evidence, anti-cyclone, wave breaking, lightning, or transport? • How representative for the 2013 summertime ozone? Figure 1a. the Atmospheric Science Department of UAH 5. Conclusions and future plan Table 2. Dates for DC8 overpassing Huntsville during SEAC4RS 8/20 8/19 8/21 8/22 Strato source Wave breaking? Higher PBL O3, broad high, high surface T 8/28 8/30 8/27 Figure 4. UAH ozone lidar observations in Aug. showing frequent enhanced upper-tropospheric ozone and low PBL ozone associated with upper-air circulations, surface meteorological conditions, convective dynamics, and aerosol transport. Figure 1c. Ozonesonde measurement at UAH http://nsstc.uah.edu/atmchem/lidar/DIAL_data.htmlkuang@nsstc.uah.edu AGU Fall Meeting, 9-13 Dec. 2013, San Francisco, CA