Download
1 / 12
130 likes | 189 Vues
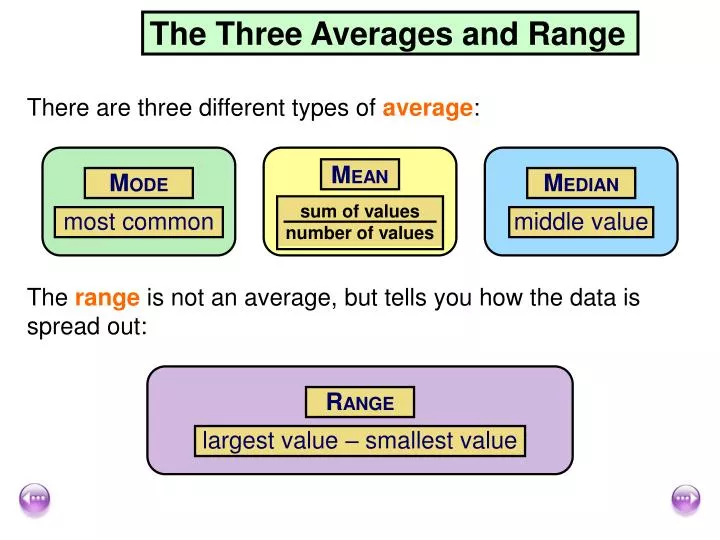
M EAN. M ODE most common. M EDIAN middle value. sum of values number of values. R ANGE largest value – smallest value. The Three Averages and Range. There are three different types of average :. The range is not an average, but tells you how the data is spread out:. 20. 15.

E N D
MEAN MODE most common MEDIAN middle value sum of values number of values RANGE largest value – smallest value The Three Averages and Range There are three different types of average: The range is not an average, but tells you how the data is spread out:
20 15 Frequency 10 5 0 Shot Sprint Discus Javelin Hurdles High jump Long jump Triple jump Long distance running Favourite athletics event This graph shows pupils’ favourite athletics events. Which is the most popular event? How do you know?
Outliers and their effect on the mean The school athletics team take part in an inter-schools competition. James’s shot results (in metres) are below. 9.46 9.25 8.77 10.25 10.35 9.59 4.02 • Discuss: • What is the mean throw? • Is this a fair representation of James’s ability? Explain. • What would be a fair way for the competition to operate? A data item that is significantly higher or lower than the other items is called an outlier. Outliers affect the mean, by reducing or increasing it.
Outliers and their effect on the mean Here are some 1500 metre race results in minutes. 6.26 6.28 6.30 6.39 5.38 4.54 10.59 6.35 7.01 Discuss: • Are there any outliers? • Will the mean be increased or reduced by the outlier? • Calculate the mean with the outlier. • Now calculate the mean without the outlier. How much • does it change? It may be appropriate in research or experiments to remove an outlier before carrying out analysis of results.
Numbers of sports played Frequency Number of sports × frequency 0 20 1 17 2 15 3 10 4 9 5 3 6 2 Calculating the mean from a frequency table 0 × 20 = 0 1 × 17 = 17 2 × 15 = 30 3 × 10 = 30 4 × 9 = 36 5 × 3 = 15 6 × 2 = 12 TOTAL 76 140 Mean = 140 ÷ 76 = 1.84 2 sports (to the nearest whole)
Starter Draw up a frequency table and find the mean number of warts per witch.
The mean number of warts is 43 ÷ 16 = 2.69 (2 d.p.) What is the mode number of warts?
Numbers of sports played Frequency Number of sports × frequency 0 20 1 17 2 15 3 10 4 9 5 3 6 2 Calculating the median from a frequency table 0 × 20 = 0 1 × 17 = 17 2 × 15 = 30 3 × 10 = 30 4 × 9 = 36 5 × 3 = 15 6 × 2 = 12 TOTAL 76 140 Median = middle number = 76 ÷ 2 = 38 This occurs in the 2 category so we would say the median is 2
Grouped data Here are the Year Ten boys’ javelin scores. How could you calculate the mean from this data? How is the data different from the previous examples you have calculated with? Because the data is grouped, we do not know individual scores. It is not possible to add up the scores.
Midpoints It is possible to find an estimate for the mean. This is done by finding the midpoint of each group. To find the midpoint of the group 10 ≤ d < 15: 10 + 15 = 25 25 ÷ 2 = 12.5 m Find the midpoints of the other groups.
Javelin distances in metres Frequency Midpoint Frequency × midpoint 5 ≤ d < 10 1 10 ≤ d < 15 8 15 ≤ d < 20 12 20 ≤ d < 25 10 25 ≤ d < 30 3 30 ≤ d < 35 1 35 ≤ d < 40 1 Estimating the mean from grouped data 7.5 1 × 7.5 = 7.5 12.5 8 × 12.5 = 100 17.5 12 × 17.5 = 210 22.5 10 × 22.5 = 225 27.5 3 × 27.5 = 82.5 32.5 1 × 32.5 = 32.5 37.5 1 × 37.5 = 37.5 TOTAL 36 695 Estimated mean = 695 ÷ 36 = 19.3 m (to 1 d.p.)
How accurate is the estimated mean? Here are the javelin distances thrown by Year 10 before the data was grouped. Work out the mean from the original data above and compare it with the estimated mean found from the grouped data. The estimated mean is 19.3 metres (to 1 d.p.). The actual mean is 18.7 metres (to 1 d.p.). How accurate was the estimated mean?