Download
1 / 38
400 likes | 425 Vues
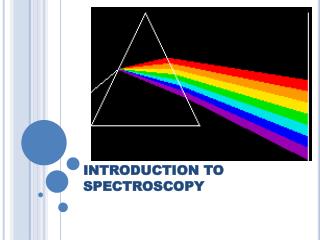
Introduction to Spectroscopy. Spectroscopy involves an interaction between matter and light (electromagnetic radiation) Light can be thought of as waves of energy or packets (particles) of energy called photons Properties of light waves include wavelength and frequency.

E N D
Introduction to Spectroscopy • Spectroscopy involves an interaction between matter and light (electromagnetic radiation) • Light can be thought of as waves of energy or packets (particles) of energy called photons • Properties of light waves include wavelength and frequency
Electromagnetic Radiation Spectrum • There are many wavelengths of light that can not be observed with your eyes
Spectroscopy used in Chemistry • When light interacts with molecules, the effect depends on the wavelength of light used • This chapter focuses on IR spectroscopy
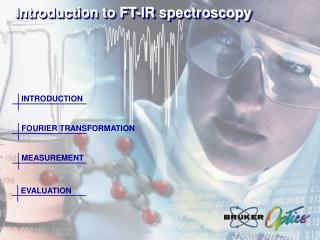
15.2 IR Spectroscopy • An IR spectrophotometer irradiates a sample with all frequencies of IR light • Detector determine the degrees of absorption at all frequencies to show the presence of certain bonds (functional groups) Media used to determine the IR spectra: • Samples are deposited neat on a salt (NaCl) plate. • Or, sample dissolved in a solvent or embedded in a KBr pellet
Bond vibration patterns • Molecular bonds can vibrate by stretching or by bending in a number of ways • This chapter will focus mostly on stretching frequencies
Energy level from Bond Vibration • The energy necessary to cause vibration depends on the type of bond
IR absorption from Bond Vibration • For each bond, vibrational energy levels are separated by gaps (quantized) • If a photon (light) strikes the molecule with the exact amount of energy needed, a molecular vibration will occur • Energy is eventually released from the molecule generally as heat • Infrared (IR) Light generally causes molecular vibration • HOW IR light is absorbed molecular structure
IR Spectroscopy • A signal on the IR spectrum has three important characteristics: wavenumber, intensity, and shape
Classification of IR in Structure Analysis • The region above 1500 cm-1 : diagnostic region. • The region below 1500 cm-1 : the fingerprint region. FINGERPRINT REGION DIAGNOSTIC REGION
IR of –OH group: Ether vs. Alcohol CH3OCH3 CH3CH2OH
IR of C=O group: Alcohol vs. Carboxylic acid Ethanol (-OH) acetic acid (>C=O & -OH)
Wavenumber: Bond and Mass • The wavenumber for a stretching vibration depends on the bond strength and the mass of the atoms bonded together • Heavier atoms causes lower frequency IR
IR Wavenumber: Bond and Mass Stronger bond causes higher frequency stretch vibration (higher wavenumber) Heavier atoms causes lower frequency stretch vibration
IR wavenumber: Hybridization • Same C-H bond, different hybridization: • C-H bond (carbon being sp hybridized) is strongest.
IR pattern for C-H of dif. hybridization • The region ≈3000 cm-1 : sp3, sp2, sp
IR for hydrocarbon w/o unique C-H • List the absorption around wavenumbers (in cm-1 ) of 3000 cm-1 for the molecules below: A. 3300 B. 3100 C. 2900 I II III
Resonance affects wavenumber • Consider a carbonyl that has two resonance contributors • C=O ~1720 cm-1, C-O 1120 cm-1 • If there were more contributors with C-O single bond character than C=O double bond character, the observed wavenumber is in between C-O and C=O bonds.
15.4 IR Signal Strength • The strength of IR signals can vary
Molecular Symmetry vs. Signal Strength • Note the general strength of the C=O stretching signal vs. the C=C stretching signal • Typical C=C bond has absorption at 1500-2000 cm-1 • A symmetrical molecule with a completely nonpolar C=C bond: 2,3-dimethyl-2-butene, no IR signal in the 1500-2000 cm-1 region
#Bonds affects IR Signal Strength • Stronger signals are also observed when there are multiple bonds of the same type vibrating • Although C-H bonds are not very polar, they often give very strong signals, due to the large number of C-H bonds • Because sample concentration can affect signal strength, the Intoxilyzer 5000 can be used to determine blood alcohol levels be analyzing the strength of C-H bond stretching in blood samples
15.5 IR Signal Shape • Some IR signals are broad, while others are very narrow • O-H stretching signals are often quite broad
Hydrogen bonding affects Shape • When possible, O-H bonds form H-bonds that weaken the O-H bond strength • The H-bonds are transient, so the sample will contain molecules with varying O-H bond strengths • Varying O-H bond strength leads to broad band signals. • If no H-bonding: The O-H stretch signal will be narrow if a dilute solution of an alcohol is prepared in a solvent incapable of H-bonding
Example of signal for O-H bond • In a sample with an intermediate concentration, both narrow and broad signals are observed. • Explain the cm-1 readings for the two O-H stretching peaks
IR Signal Shape for Carboxylic Acid • Consider how broad the O-H stretch is for a carboxylic acid and how its wavenumber is around 3000 cm-1 rather than 3400 cm-1 for a typical O-H stretch
Carboxylic Acid forms Dimers • H-bonding is often more pronounced in carboxylic acids, because they can forms H-bonding dimers (two molecules bonded through H-bonding)
Practice: Predicting IR Signal Shape • For the molecule below, predict all of the stretching signals in the diagnostic region: • X-H: O-H, -C-H, =C-H • X=Y: C=C, C=O (conjugated with C=C)
Signal Shape for Amine (N-H) • Primary and secondary amines exhibit N-H stretching signals. • Tertiary amines has no N-H bond. • Because N-H bonds are capable of H-bonding, their stretching signals are often broadened • N-H bonds are less polar than O-H bond, thus weak signals.
IR Signal Shape for –NH2 • The appearance of two N-H signals for the primary amine is NOT simply the result of each N-H bond giving a different signal • Instead, the two N-H bonds vibrate together in two different ways
Symmetry of Vibration • A single molecule can only vibrate symmetrically or asymmetrically at any given moment, so why do we see both signals at the same time? • Similarly, CH2and CH3 groups can also vibrate as a group giving rise to multiple signals • Practice with conceptual checkpoint 15.10
Effect of solvation on IR • Explain how an experiment involving isotopic labeling might be used to explore the type of fragmentation that occurs in the MS analysis of organic compounds.
15.6 Analyzing an IR Spectrum • Table 15.2: key signals for functional groups • Often, the molecular structure can be identified from an IR spectra • Focus on the diagnostic region (above 1500 cm-1) • 1600-1850 cm-1 – check for double bonds (C=O or C=C) • 2100-2300 cm-1 – check for triple bonds (CN or CC) • 2700-4000 cm-1 – check for X-H bonds (C-H, O-H, N-H) • Analyze wavenumber, intensity, and shape for each signal
Analyzing an IR Spectrum • Focus on the 2700-4000 cm-1 (X-H) region • Practice with SkillBuilder 15.1
15.7 Using IR to Distinguish Between Molecules • As we have learned in previous chapters, organic chemists often carry out reactions to convert one functional group into another • IR spectroscopy can often be used to determine the success of such reactions • For the reaction below, how might IR spectroscopy be used to analyze the reaction? • Practice with SkillBuilder 15.2
Practice: Using IR to Distinguish Between Molecules • For the reactions below, identify the key functional groups, and describe how IR data could be used to verify the formation of product • Is IR analysis qualitative or quantitative?
Additional Practice Problems • Explain how an experiment involving isotopic labeling might be used to explore the type of fragmentation that occurs in the MS analysis of organic compounds.