Download
1 / 40
500 likes | 942 Vues
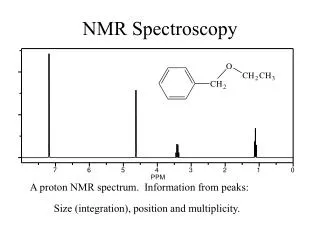
Introduction to NMR Spectroscopy. Part I. Introduction. Nuclear Magnetic Resonance (NMR) Spectroscopy is a technique that is used to determine the type, number and relative positions of certain atoms in a molecule

E N D
Introduction • Nuclear Magnetic Resonance (NMR) Spectroscopy is a technique that is used to determine the type, number and relative positions of certain atoms in a molecule • Originally discovered by Felix Bloch and Edward Purcell in 1946 (both shared the Nobel Prize in Physics in 1952 for their pioneering work), it has seen a significant increase in popularity with the development of FT-NMR spectrometers
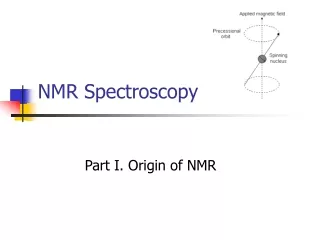
Physical Background of NMR Spectroscopy I • Nuclei, which are moving and charged particles, generate a magnetic field when doing so • The precession of a nucleus with a nonzero magnetic momentum can be described using a vector model • Generally, the precession is a quantized phenomenon • The magnetic moment m is either aligned (mI=½) or opposed (mI= -½)(for a nucleus with I=½) to the applied field, resulting into two energy states • The magnetic moment massumes (2*I+1) states for a nucleus in an applied field Energy mI= -½ DE= f(gBo)= hn mI= +½ Increased magnetic field Bo
Physical Background of NMR Spectroscopy II • A resonance phenomenon occurs when the aligned nuclei interact with the applied field and are forced to change their spin orientation • The energy, which is absorbed, is equal to energy difference DE between the two spin states. This resonance energy is about 10-6 kJ/mol, which corresponds to energy in the radio-frequency region • The stronger the applied field, the greater energy difference between the spin states (DE) becomes, which allows distinguishing even between very similar atoms • The NMR spectrometers with stronger magnetic fields provide better resolution revealing more details about the structure of a molecule because they separate the signals more (i.e., 1-bromobutane) • The NMR experiment itself becomes more sensitive as well because saturation is less of a problemdue to a more uneven population of the energy levels 60 MHz 600 MHz
Physical Background of NMR Spectroscopy III • The exact resonance frequency of a certain nucleus depends on the environment of the nucleus. The effective magnetic field is a result of the applied magnetic field and the changes that are induced by the environment • The changes are often summarized into a shielding constant, s. • The larger the shielding constant and the smaller the effective field, the higher the applied field has to be in order for the nucleus to resonate as constant frequency (=shift to lower d-values in the 1H-NMR spectrum) • If a constant magnetic field is applied, the resonance frequency will decrease with increasing shielding • In 1H-NMR spectroscopy, the diamagnetic and neighboring effects are the most important contributions because only s-orbitals are important • In 13C-NMR, the paramagnetic term becomes more significant because of the involvement of p-electrons
NMR Active Nuclei • Although hydrogen atoms and carbon atoms are typically of most interest to organic chemist, there are many other nuclei that are of common interest • Most elements possess at least one NMR active nucleus, but many of them several (i.e.,115Sn, 117Sn and 119Sn, 95Mo and 97Mo, etc.). In order for an atom to be NMR active, the spin quantum number (I) must not equal zero. • If the proton and neutron number are even, the spin quantum number will be zero. Both 12C and 16O will not be observable, but 13C, 1H and 17O are NMR active nuclei. • Nuclei with a spin quantum number larger than I=½ often show broad lines because of their quadrupole moment • There is a significant difference in abundance in these NMR active nuclei and the sensitivity of these experiments differs quite a bit as well.
Information from the NMR Spectrum I • Symmetry • If there are fewer signals than atoms of a particular kind, there has to be symmetry in the molecule because atoms with the same chemical (or more accurately magnetic) environment show up at the same location in the spectrum, which usually results in a larger signal. • Even for simple groups this assumes that there is free rotation about s-bonds which will strictly speaking only be true when the temperature is high enough to provide enough energy for this process and if there is no preferentially arrangement of the molecule that generates an asymmetric environment (i.e., intramolecular hydrogen bonds, resonance, etc.).
Information from the NMR Spectrum II • Multiplet • From coupled spectra, it is possible to obtain information about the neighboring atoms based on the splitting for each signal • This holds especially true for proton spectra, where the multiplet structure reveals how many hydrogen neighbors a given CHx-function (x=1-3) has • Most of the 13C-NMR spectra are obtained as proton-decoupled spectra (13C{1H}), which means that this information cannot be obtained from those spectra. However, the coupling with other nuclei (i.e., D, F, P, etc.) will still be observed • The low abundance of 13C nuclei makes it very difficult to observe 13C-13C-couplings in these spectra, but this information can be obtained from 13C-enriched samples
Information from the NMR Spectrum III • Integration • Integration permits to determine the relative abundance of a certain type of nucleus compared to other nuclei (after normalization) • The integral is the area under a signal (group), which is expressed as an integral line over the signal or a number beneath the signal. Integration is not the height of a signal! • Integration works relatively well for 1H-NMR spectra, but less well for 13C-NMR and some other nuclei because the relaxation times vary much more for these nuclei • Even in 1H-NMR spectroscopy, this is not an absolute measurement either because large signals often have less intensity than they should have compared to small signals • If signals are too close together, the software often integrates them together as well which means that the integration line has to be used to determine the individual integration • Very broad signals are sometimes also very difficult to analyze because the integration limits are somewhat set arbitrarily
Information from the NMR Spectrum IV • 1. Chemical Shift • Finally, the chemical shift of a signal permits indirect conclusions about the presence of certain heteroatoms and functionalities • Electronegative heteroatoms i.e., oxygen, fluorine, chlorine, etc. cause a shift to higher ppm values, as does sp2-hybridization (see below). The chemical shift d(ort in the older literature) is defined by • These values are generally given in units of ppm (parts per million) because the observed changes are very small compared to the applied magnetic field • The chemical shift (d) is measured against a standard reference, tetramethylsilane (TMS), which is defined as zero (d=0.00 ppm) and is independent from the applied magnetic field • The older literature sometimes provides chemical shifts as offset (compared to a reference compound) in terms of Hz • In older literature, the t-scale (d=0.00 ppm ↔ t=10.00 ppm) is used. In the t-scale shifts to the left where considered downfieldshifts because the field strength decreases in this direction. • Shifts to the right were defined as upfield shifts because the magnetic field increases and therefore the t-value. Using the d-scale, a shift to higher d-values would be equivalent to a downfield shift.
1H-NMR Spectroscopy – Chemical Shift CH3F • The chemical shift of protons is mainly due to the effect of neighboring groups, which are either electron-withdrawing groups/atoms that cause protons to be more deshielded, or electron-donating groups/atoms, which results in more shielded protons. • The first group causes a shift downfield (to higher ppm values!), while the second group causes the signals to appear upfield (at lower ppm values). Several effects influence these shifts. • Electronegativity (red line in graphs on the right is d=3 ppm) • The higher the electronegativity of the attached heteroatom, the further downfield the corresponding signal is shifted due to the deshielding of the hydrogen atom. Note that the effect is fairly pronounced in some cases because hydrogen is less electronegative compared to carbon (EN=2.5). CH3Cl CH3Br CH3I
1H-NMR Spectroscopy – Chemical Shift • Hybridization • Hydrogen atoms from saturated systems (sp3 without functional groups) appear usually between d=0-2 ppm • Those, which are attached to sp2carbon atoms (alkenes, arenes) are found in the range between d=4.5-8 ppm • Alkyne protons are located between d=2-3 ppm due an anomalous anisotropy (see next slide) • Aldehyde protons can be found in the range between d=9-11 ppm due to the fact that they are attached to a sp2-carbon andalso experience the electronegativity of the oxygen atom • Imine functions (H-C=N) usually are found around d=8-8.5 ppm due to the lower electronegativity of nitrogen compared oxygen
1H-NMR Spectroscopy – Chemical Shift • Hybridization • In arenes, alkenes, alkynes and for carbonyl functions a special effect is observed, called anisotropy • These functional groups possess circulating p-electrons, which cause a secondary magnetic field • The chemical shift of the protons in these molecules highly depends where these protons are located in respect to this secondary magnetic field. (“+” denotes shielded areas, while “-“ denotes deshielded areas) • In the case of arenes, alkenes and carbonyl functions these protons exhibit less shielding and are shifted downfield • In alkynes, the protons are located in the area of increased shielding and therefore are less shifted than alkene protons
1H-NMR Spectroscopy – Chemical Shift • Hybridization • In some cases, the shielding through a secondary magnetic field is so strong that these protons appear at negative d-values as in the example ([18]-annulene) below at low temperatures • The system has 18 p-electrons, hence it is considered aromatic. The inner hydrogen atoms (Hi) are highly shielded, while the outer ones are highly deshielded • A similar trend is observed for porphyrins in which the inner protons appear at d= -3 ppm. T= -70 oC: Hi: d = -2.99 ppm (6 H), Ho:d=9.28 ppm (12 H) T= +110 oC: d=5.45 ppm (weighted average: d=5.19 ppm)
1H-NMR Spectroscopy – Chemical Shift • Acidic and exchangeable protons • The protons of phenols, alcohols, amines and amides can be found in very broad range between d=0.5 and 7 ppm while protons of carboxylic acids show up in the range between d=10.5 and 12 ppm. • In some cases, enol type protons can appear as high as d=15-16 ppm i.e., acetyl acetone (2,5-pentanedione, H3CCOCH2COCH3) • The appearance of the signal depends highly on the condition at which the spectrum was obtained (solvent, temperature, concentration, impurities, etc.). • In diluted solutions and in nonpolar solvents sharp peaks are usually observed because there are no (or very little) hydrogen bonding between the X-H-functions (X=O, N) • In more concentrated solution, broad peaks are observed that can also easily be overlooked • Many of these protons can be exchanged by treating the solution with D2O. The corresponding signal would disappear in the 1H-NMR spectrum if the proton was exchangeable, which simplifies the spectrum.
1H-NMR Spectroscopy - Integration • 2. Integration • The NMR spectroscopy cannot only distinguish between magnetically different protons, but also determine the approximate ratio of these protons • The NMR spectrometer does the integration and provides the information either as a number under the signal as shown in the spectrum below (39.9 and 60.0) or draws a vertically rising line • In order to determine the true ratio of the signals, the distance between the foot and the top of the integration line above a peak has to be measured • All values are then divided by the smallest number to obtain the relative ratios. If a ratio is not an integer (i.e., 1:1.5), a factor has to be found to make it an integer as shown in the example above (multiply by 2 makes it 2:3)
1H-NMR Spectroscopy - Multiplet • 3. Multiplet structure • The multiplet structure of a signal is due to a spin-spin splitting of magnetically non-equivalent protons. For a group of n adjacent protons, a signal containing (2*n*I+1=2*n*½= n+1 for I=½) peaks is observed. • For instance, bromoethane exhibits a triplet (=three peaks) at d=1.53 ppm for the methyl group (CH3) due to the splitting from the two neighboring hydrogen atoms. • The methylene group (CH2) shows as a quartet (=four peaks) at d=3.31 ppm, which is shifted downfield because of the bromine attached to the same carbon atom. • There is no splitting observed within the methyl or methylene group here because there is a free rotation about the C-C single bond making all protons within these groups chemically equivalent. • The distance between the individual peaks of a multiplet is called spin coupling constant (J).
1H-NMR Spectroscopy - Multiplet • 3. Multiplet structure • These protons can have different spins (mI= ±½) and therefore cause an additional shielding (same spin compared to the applied field) or deshielding (opposite spin) of the observed protons. If there are more than one hydrogen atom on the adjacent C-atom, more spin arrangements will be possible i.e., methyl group. • The methylene group will appear as a quartet. The four lines will display a relative intensity of 1:3:3:1 (theoretically).
1H-NMR Spectroscopy - Multiplet • 3. Multiplet structure • A neighboring methyl group splits a signal into a quartet, which ideally shows relative intensities of the peaks of 1:3:3:1. Generally, the line intensities can be predicted using Pascal’s triangle (for well separated multiplets using nCr): • 1Singlet • 1 1 Doublet • 1 2 1 Triplet • 1 3 3 1 Quartet • 1 4 6 4 1 Quintet • 1 5 10 10 5 1 Sextet • 1 6 15 20 15 6 1 Septet • 17 21 35 35 21 7 1 Octet • 1 8 28 56 70 56 28 8 1 Nonet • The higher the multiplicity, the smaller the outer lines are compared to the next line • In cases, when a lot of lines are observed, it is difficult to identify the exact number of lines within a multiplet because the outermost lines are barely (or not) visible in those cases • Sometimes it helps to determine the ratio of the two lines farthest to the outside of the multiplet.
1H-NMR Spectroscopy - Multiplet • 3. Multiplet structure • If the coupling multiplets are close together, the ratio of the intensity of the lines changes. This effect is called multiplet skewing (“leaning”) and allows one to locate the coupling partner. • The outermost lines tend to be smaller than the innermost lines of a coupling system as the following scheme. • This effect is the greater the closer the signals are. This can even lead to the disappearance of the outermost lines i.e., in the aromatic range because the signals are relatively close together there. In some cases a triplet converts into a ‘doublet’ or two doublets appear as one ‘singlet’ due to this effect.
1H-NMR Spectroscopy - Multiplet • 3. Multiplet structure • Common splitting patterns for alkyl groups • Alkyl groups show relatively simple and characteristic splitting patterns (as shown in the table above). Note that strictly speaking the “sextet” in the n-propyl group is a triplet of quartets. • However, the complicated splitting pattern will only be observed if the coupling constants and/or chemical shifts are very different for the methylene and the methyl group.
1H-NMR Spectroscopy - Multiplet • 3. Multiplet structure • The situation is more complicated in aromatic systems, which often show very complicated (due to overlap and long-range coupling through the p-system) and difficult to analyze patterns for beginners. • The following examples illustrate some important points but are by all means far from being complete. • The first step is to understand the patterns in the aromatic range due to symmetry, the second step is to identify the effect of different groups onto the various protons on the ring. • Aromatic protons usually show up in the range of d=6-9 ppm (Strictly speaking, the coupling patterns are much more complicated, but for the sake of simplicity only first order couplings will be analyzed here because this is what can be observed on a normal spectrum!)
1H-NMR Spectroscopy - Monosubstitution • Mono-substitution (general) • A mono-substituted benzene ring has a plane of symmetry going through Ciand Cp atom. • As a result, there are only three different types of protons observed. Ho should show a doublet, while Hm and Hp appear as a triplet each (strictly speaking a doublet of doublets). • The integrations for Ho(2 H), Hm(2 H) and Hp (1 H), respectively.
1H-NMR Spectroscopy - Monosubstitution • Mono-substitution (examples) • Toluene • The two signal groups at d=7.4-7.5 ppm corresponds to the ring protons, while the singlet at d=2.6 ppm is due to the methyl group on the ring. • The expansion of the aromatic range on the right hand side shows a triplet (Hm) and a triplet (Hp) that is overlapped by a doublet (Ho) on the left side. The ortho and para protons are shifted about the same if a methyl group is attached to the ring (Dd = -0.18 ppm (ortho) and Dd= -0.20 ppm (para)). • In addition, a strong multiplet skewing is observed because the signals are very close together. Note that the two outer lines of the triplet at d=7.5 ppm possess very different intensities. m o p
1H-NMR Spectroscopy - Monosubstitution • Mono-substitution (examples) • Anisole • p o • If the substituent R was an electron-donating group i.e., alkoxy (i.e., anisole), amino (i.e.,aniline), a distinguished splitting of the protons would be observed in this region of the spectrum. • The meta protons are slightly shifted downfield (triplet at d=7.48 ppm), while the ortho (doublet at d=7.12 ppm) and para protons (triplet at d=7.15 ppm) are shifted upfield, because the electron-density increased in these positions (as shown in the diagram). • The same effect can be seen in the reactivity of these compounds in electrophilic aromatic substitutions (EAS) in these positions. • The singlet around d=3.9 ppm is due to the methyl group that is attached to the oxygen atom. m p o
1H-NMR Spectroscopy - Monosubstitution • Mono-substitution (examples) • N,N-dimethylaniline • The triplet at d=7.66 ppm is due to the meta protons, while the doublet for the ortho and para proton overlaps d=7.1-7.2 ppm. • The methyl groups are less shifted (d=3.2 ppm) due to the lower electronegativity of the nitrogen atom as compared to the oxygen atom, but the integration for this signal is higher because it represents six equivalent hydrogen atoms. m p o
1H-NMR Spectroscopy - Monosubstitution • Mono-substitution (examples) • Ethyl benzoate • The signal at d=8.0 ppm is due to ortho hydrogen atoms (downfield shift ~0.65 ppm), while the signal at d=7.2-7.4 ppm is due to the meta and para hydrogen atoms (both triplets downfield shift about 0.1-0.2 ppm). • The quartet at d=4.3 ppm corresponds to the CH2-group in the ester part. The increased shift is due to the oxygen atom of the ester function. The triplet at d=1.35 ppm is due to the methyl group. o p m
1H-NMR Spectroscopy - Monosubstitution • Electron-donating groups • The ortho/para protons are shifted upfield due to the increased electron-density in these positions (partial negative charge) • Groups: -OR, -OH, -NR2, -alkyl • Electron-withdrawing groups • The ortho protons are shifted downfield due to the decreased electron-density in this position (partial positive charge) • Groups: carbonyl, nitro, sulfo
1H-NMR Spectroscopy – Parasubstitution • Para substitution (general) • Case 1: both substituents are the same • The molecule has two symmetry planes perpendicular to each other • All four protons on the ring will be chemically equivalent resulting in one singlet in the 1H-NMR spectrum because they do not couple with each other. • Case 2: two different substituents • There is only one symmetry plane in the molecule • There are two different types of hydrogen atoms on the ring. Usually two doublets are observed for this substitution pattern.
1H-NMR Spectroscopy – Parasubstitution • Para substitution (examples) • Case 1: p-dichlorobenzene • Both compounds display one singlet for the aromatic protons due to the high symmetry • P-Xylene displays an additional peak at d=2.2 ppm due to the methyl groups on the ring • p-xylene
1H-NMR Spectroscopy – Parasubstitution • Para substitution (examples) • Case 2: p-Nitrophenol • If X=donor and Y=acceptor, typically an AA’BB’ spin system (=two doublets in first order coupling) is observed. The molecule possesses one symmetry plane. • The two protons near the X=acceptor will be shifted downfield (Dd=0.95 ppm forX=NO2), while the two protons near Y=donor will be shifted upfield (Dd=0.56 ppm for Y=OH). • The typical coupling constant in this case ranges from J3=7-10 Hz (coupling between two adjacent hydrogen atoms on the ring). • The broad signal at d=6.3 ppm is due to the phenolic OH group. This signal will change its location if a different solvent is used to acquire the NMR spectrum. H2 H1 OH
1H-NMR Spectroscopy – Orthosubstitution • Ortho substitution (general) • Case 1: both substituents are the same • This substitution pattern will usually lead to a symmetric set of signals, consisting of a doublet (H1) and a “triplet” (H2),both with an integral of two hydrogen atoms. • Often times, these signals are very close together and/or overlap. However, the signal groups are usually relatively symmetric. • Case 2: two different substituents • An asymmetric ortho-substitution leads to a very complex splitting pattern in the aromatic range because there is no symmetry anymore (H1 and H4 form a doublet each, H2 and H3 form a triplet each, integration one hydrogen atom each). • Due to the possible overlap, these patterns are often difficult to recognize and analyze as well.
1H-NMR Spectroscopy – Orthosubstitution • Ortho substitution (examples) • Case 1: o-dichlorobenzene • The spectrum of o-dichloromethane displays two signal groups, while the two groups overlap in the case of o-xylene • The additional signal at d=2.2 ppm is due to the two methyl groups on the ring • o-xylene
1H-NMR Spectroscopy – Orthosubstitution • Ortho substitution (examples) • Case 2: o-nitrophenol • In the spectrum of o-nitrophenol, a doublet (d=~8.01 ppm, H1 if X=NO2 and Y=OH) and a triplet (d=~7.52 ppm, H3) can clearly be identified. • The other doublet (d=7.08 ppm) and the triplet (d=6.90 ppm) are due to H4 and H2, respectively. • The phenol function forms a strong intramolecular hydrogen bond with neighboring nitro group and is therefore more shifted downfield (d=~10.5 ppm) OH H1H3 H4 H2
1H-NMR Spectroscopy – Metasubstitution • Meta substitution (general) • Case 1: both substituents are the same • If both substituents are the identical, a symmetry plane (going through C1 and C4) will be observed in the molecule. • As a result three signals are observed: a singlet (H1), a doublet (H2) and a triplet (H3) (integration ratio: 1 H:2 H:1 H). • Due to the possible overlap, these patterns are often difficult to recognize and analyze as well. • Case 2: two different substituents • An asymmetric meta-substitution leads to a very complex splitting pattern in the aromatic range: H1 forms a singlet, H2 and H4 show as a doublet each, and H3 as a triplet (integration one hydrogen each). • Due to the possible overlap, these patterns are often difficult to recognize and analyze as well.
1H-NMR Spectroscopy – Metasubstitution • Ortho substitution (examples) • Case 1: m-dichlorobenzene • For m-dichlorobenzene, the expected singlet for H1 is not signal most downfield. The signals for H2 and H3 overlap at d=7.2 ppm. • The additional signal at d=2.3 ppm is due to the two methyl groups on the ring • m-xylene H1 H2/H3
1H-NMR Spectroscopy – Metasubstitution • Ortho substitution (examples) • Case 2: m-nitroaniline • For m-nitroaniline (Y=NO2, X=NH2) the signal for H1 located at d=7.47 ppm is clearly a singlet (H1). • The two doublets (at d=6.95 and d=7.54 ppm) are a result of H2and H4. • The signal at d=7.25 ppm is a triplet, which is due to H3. • The amino group appears as a broad signal at d=~4.0 ppm. NH2 H4 H1 H3 H2
1H-NMR Spectroscopy – Coupling Constants • Coupling constants • The spacing between the lines of a multiplet is called coupling constant. • The coupling constant is identical within the multiplet and its coupling partner. In other words, nucleus A couples with nucleus B with the coupling constant JAB, and nucleus B couples with nucleus A with the same coupling constant, JAB. This allows matching multiplets, which couple with each other. • Signal splitting results from spin-spin coupling of neighboring protons and is generally observed if: • 1. the protons are no more than 2 or 3 s bonds apart (J2 and J3). • 2. the protons are not magnetically equivalent. • 3. it can occur through the p bonds (long-range coupling) and this is why splitting patterns of aromatic protons are often difficult to analyze.
1H-NMR Spectroscopy – Coupling Constants • Coupling constants • Coupling constants are angle dependent as can be seen in the in the diagram below, which was generated using the vicinal Karplusrelationship (M. Karplus, Noble Prize in Chemistry in 2013). • The highest J-values are obtained for angles of Q=0 and 180o, while the J-value for Q=90o is very small. • The degree of coupling is a function of the overlap of the involved orbitals. If they are co-aligned, the interaction will be very strong. If they are perpendicular, the overlap is going to be weak resulting in a low coupling constant.
1H-NMR Spectroscopy – Coupling Constants • Coupling constants • Coupling constants are obtained from the NMR spectrum by the following equation: • J (in Hz) = average line spacing in multiplet (in ppm) * sweep frequency (in MHz) • Coupling constants are usually given in Hertz (Hz) and not in ppm. For proton spectra they are usually in the range of JH-H=0-20 Hz (see below),while the coupling constants with other nuclei are often significantly larger (~102-103 Hz) i.e., JH-F(CH2F2)= 50 Hz, JP-H((CH3)2PH)=192 Hz, etc. Coupling constants are independent from sweep frequency of the NMR spectrometer used.