Download
1 / 42
670 likes | 1.28k Vues
NMR Spectroscopy. Abu Yousuf , PhD Associate Professor Department of Chemical Engineering & Polymer Science Shahjalal University of Science & Technology Sylhet-3114, Bangladesh ayousufcep@yahoo.com. NMR Spectroscopy.

E N D
NMR Spectroscopy Abu Yousuf , PhDAssociate Professor Department of Chemical Engineering & Polymer Science Shahjalal University of Science & Technology Sylhet-3114, Bangladesh ayousufcep@yahoo.com
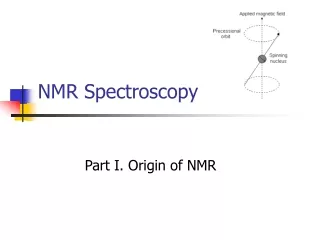
NMR Spectroscopy • Nuclear magnetic resonance (NMR) spectroscopy: A spectroscopic technique that gives us information about the number and types of atoms in a molecule, for example, about the number and types of • hydrogen atoms using 1H-NMR spectroscopy. • carbon atoms using 13C-NMR spectroscopy. • phosphorus atoms using 31P-NMR spectroscopy.
Nuclear Spin States • An electron has a spin quantum number of 1/2 with allowed values of +1/2 and -1/2. • This spinning charge has an associated magnetic field. • In effect, an electron behaves as if it is a tiny bar magnet and has what is called a magnetic moment. • The same effect holds for certain atomic nuclei. • Any atomic nucleus that has an odd mass number, an odd atomic number, or both, also has a spin and a resulting nuclear magnetic moment. • The allowed nuclear spin states are determined by the spin quantum number, I, of the nucleus.
Nuclear Spin States • A nucleus with spin quantum number I has 2I + 1 spin states; if I = 1/2, there are two allowed spin states. • Spin quantum numbers and allowed nuclear spin states for atoms common to organic compounds.
Nuclear Magnetic Resonance Spectroscopy Nuclear spins are oriented randomly in the absence (a) of an external magnetic field but have a specific orientation in the presence (b) of an external field, B0 • Some nuclear spins are aligned parallel to the external field • Lower energy orientation • More likely • Some nuclear spins are aligned antiparallel to the external field • Higher energy orientation • Less likely
Nuclear Spins in B0 • Units used: • A = ampere • C = coulomb • kg = kilogram • m = meter • N = newton • s = second • T = tesla • V = volt • Wb = weber Tesla- A particle carrying a charge of 1 coulomb and passing through a magnetic field of 1 tesla at a speed of 1 meter per second perpendicular to said field experiences a force of 1 newton,
Nuclear Magnetic Resonance Spectroscopy When nuclei that are aligned parallel with an external magnetic field are irradiated (To expose to radiation) with the proper frequency of electromagnetic radiation the energy is absorbed and the nuclei “spin-flips” to the higher-energy antiparallel alignment • Nuclei that undergo “spin-flips” in response to applied radiation are said to be in resonance with the applied radiation - nuclear magnetic resonance • Frequency necessary for resonance depends on strength of external field and the identity of the nuclei
Nuclear Magnetic Resonance Spectroscopy The energy difference DE between nuclear spin states depends on the strength of the applied magnetic field • Absorption of energy with frequency n converts a nucleus from a lower to a higher spin state • DE = 8.0 x 10⁻⁵ kJ/molfor magnetic field strength of 4.7 T a • For field strength of 4.7 T a radiofrequency (rf) of n = 200 MHz is required to bring 1H nuclei into resonance • For a field strength of 4.7 Ta radiofrequency (rf) of n = 50 MHz is required to bring 13C nuclei into resonance
Nuclear Spin in B0 • The energy difference between allowed spin states increases linearly with applied field strength. • Values shown here are for 1H nuclei.
Which Nuclear exhibit NMR Many nuclei exhibit NMR phenomenon • All nuclei with odd number of protons • All nuclei with odd number of neutrons • Nuclei with even numbers of both protons and neutrons do not exhibit NMR phenomenon
What happen with absorption of Radio frequency Add Energy Energy Released N N S S S N S N N S N S Aligned = Low Energy Back to low energy ground state Excited state = High energy • When the spin falls back into line with the magnetic field it releases energy. We detect this energy and it provides information on: • The environment of the hydrogen in the molecule • How many hydrogen atoms are in that environment.
Nuclear Magnetic Resonance • When nuclei with a spin quantum number of 1/2 are placed in an applied field, a small majority of nuclear spins are aligned with the applied field in the lower energy state. • The nucleus begins to precess and traces out a cone-shaped surface, in much the same way a spinning top or gyroscope traces out a cone-shaped surface as it precesses in the earth’s gravitational field.
Nuclear Magnetic Resonance • If the precessing (the motion of a spinning body) nucleus is irradiated with electromagnetic radiation of the same frequency as the rate of precession, • the two frequencies couple • energy is absorbed • the nuclear spin is flipped from spin state +1/2 (with the applied field) to -1/2 (against the applied field).
Nuclear Magnetic Resonance • (a) Precession and (b) after absorption of electromagnetic radiation.
Nuclear Magnetic Resonance • Resonance: In NMR spectroscopy, resonance is the absorption of energy by a precessing nucleus and the resulting “flip” of its nuclear spin from a lower energy state to a higher energy state. • The precessing spins induce an oscillating magnetic field that is recorded as a signal by the instrument. • Signal: A recording in an NMR spectrum of a nuclear magnetic resonance.
The Nature of NMR Absorptions The absorption frequency is not the same for all 1H and 13C nuclei • Nuclei in molecules are surrounded by electrons • Electrons set up tiny local magnetic fields that act in opposition to the applied field, shielding the nucleus from the full effect of the external magnetic field • The effective field actually felt by the nucleus is the applied field reduced by the local shielding effects Beffective = Bapplied – Blocal
Needs high frequency energy to flip here, so high frequency energy released when it flips back. Flips quite easily – needs low frequency energy. 1) The environment of the Hydrogen atom • The frequency of energy needed to flip the magnet (Spin) is different for hydrogen atoms that are in different positions. • So the type of energy given off tells us the position of the hydrogen in the molecule.
2) How many hydrogen atoms are in each position If one hydrogen releases a set amount of energy when it falls back in line (eg 2 units). Then 3 hydrogen atoms will release 3 times that amount when they fall in line (6 units). This affects the size of the peak in the NMR spectrum. The more hydrogen atoms, the bigger the peak!
Interpreting NMR Spectra • Counting Hydrogen environments – One molecule can contain many hydrogen environments. Each environment will release a different frequency of energy when it drops down from its excited state to line up with the magnetic field. • So for each different hydrogen environment, we will see a different peak in the NMR spectrum. 2 x H environments so 2 peaks in NMR spectrum.
2 x H environments so 2 peaks in NMR spectrum. 4 x H environments so 4 peaks in NMR spectrum. 3 x H environments so 3 peaks in NMR spectrum. Your Turn!
Equivalent Hydrogens • Equivalent hydrogens:Hydrogens that have the same chemical environment. • A molecule with 1 set of equivalent hydrogens gives 1 NMR signal.
Equivalent Hydrogens • A molecule with 2 or more sets of equivalent hydrogens gives a different NMR signal for each set.
Signal Areas • Relative areas of signals are proportional to the number of H giving rise to each signal, Modern NMR spectrometers electronically integrate and record the relative area of each signal.
Chemical Shifts Chemical shift • the chemical shift is the resonant frequency of a nucleus relative to a standard • Position on NMR chart at which a nucleus absorbs • The chemical shift of TMS is set as zero point • Other absorptions normally occur downfield • NMR charts calibrated using delta (d) scale • 1 d = 1 part per million of operating frequency • Chemical shift of an NMR absorption in d units is constant, regardless of the operating frequency of the spectrometer • Since the numerator is usually in hertz, and the denominator in megahertz, delta is expressed in ppm. • Thus, an NMR signal that absorbs at 300 Hz higher than that of TMS at an applied frequency of 300 MHz has a chemical shift of:
Chemical Shifts The NMR Chart The downfield, deshielded side is on the left, and requires a lower field strength for resonance The upfield, shielded side is on the right, and requires a higher field strength for resonance The tetramethylsilane (TMS Si(CH3)4) absorption is used as a reference point
Nuclear Magnetic Resonance • The difference in resonance frequencies among the various hydrogen nuclei within a molecule due to shielding/deshielding is generally very small. • The difference in resonance frequencies for hydrogens in CH3Cl compared to CH3F under an applied field of 7.05T is only 360 Hz, which is 1.2 parts per million (ppm) compared with the irradiating frequency.
Nuclear Magnetic Resonance • Signals are measured relative to the signal of the reference compound tetramethylsilane (TMS). • For a 1H-NMR spectrum, signals are reported by their shift from the 12 H signal in TMS. • For a 13C-NMR spectrum, signals are reported by their shift from the 4 C signal in TMS. • Chemical shift ():The shift in ppm of an NMR signal from the signal of TMS.
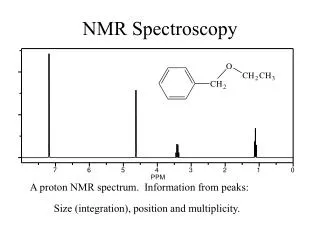
NMR Spectrum • 1H-NMR spectrum of methyl acetate. • High frequency:The shift of an NMR signal to the left on the chart paper. • Low frequency:The shift of an NMR signal to the right on the chart paper.
The Nature of NMR Absorptions The absorption frequency is not the same for all 1H and 13C nuclei • Each chemically distinct nucleus in a molecule has a slightly different electronic environment and consequently a different effective field • Each chemically distinct 13C or 1H nucleus in a molecule experiences a different effective field and will exhibit a distinct 13C or 1H NMR signal
The Nature of NMR Absorptions (a) 1H NMR spectrum and (b) 13C NMR spectrum of methyl acetate. Peak labeled “TMS” at far right is for calibration
The Nature of NMR Absorptions • The two methyl groups of methyl acetate are nonequivalent • The two sets of hydrogens absorb at different positions • When the frequency of rf irradiation is held constant and the applied field strength is varied each nucleus in a molecule comes into resonance at a slightly different field strength, mapping the carbon-hydrogen framework of an organic molecule
The Nature of NMR Absorptions The 13C spectrum of methyl acetate shows three peaks, one for each of the three chemically distinct carbon atoms in the molecule
Chemical Shifts 1H-NMR
Chemical Shift • Chemical shift depends on the • electronegativity of nearby atoms, • hybridization of adjacent atoms, and • diamagnetic effects from adjacent pi bonds. • Electronegativity
Chemical Shift • Hybridization of adjacent atoms.
Chemical Shift • Diamagnetic effects of pi bonds • A carbon-carbon triple bond shields an acetylenic hydrogen and shifts its signal to lower frequency (to the right) to a smaller value. • A carbon-carbon double bond deshields vinylic hydrogens and shifts their signal to higher frequency (to the left) to a larger value.
Chemical Shift • Magnetic induction in the p bonds of a carbon-carbon triple bond shields an acetylenic hydrogen and shifts its signal lower frequency.
Chemical Shift • Magnetic induction in the p bond of a carbon-carbon double bond deshields vinylic hydrogens and shifts their signal higher frequency.
Chemical Shift • The magnetic field induced by circulation of p electrons in an aromatic ring deshields the hydrogens on the ring and shifts their signal to higher frequency.
NMR Spectrometer • Essentials of an NMR spectrometer are a powerful magnet, a radio-frequency generator, and a radio-frequency detector. • The sample is dissolved in a solvent, most commonly CDCl3 or D2O, and placed in a sample tube which is then suspended in the magnetic field and set spinning. • Using a Fourier transform NMR (FT-NMR) spectrometer, a spectrum can be recorded in about 2 seconds.
NMR Spectrometer Schematic operation of a basic NMR spectrometer
900 MHz NMR 300 MHz NMR p. 547