Download
1 / 124
1.29k likes | 1.38k Vues
NMR Spectroscopy. Part I. Origin of NMR. Nuclei in Magnetic Field. Nucleus rotate about an axis -- spin. Nucleus bears a charge, its spin gives rise to a magnetic field . The resulting magnetic moment is oriented along the axis of spin and is proportional to angular momentum m = g p.

E N D
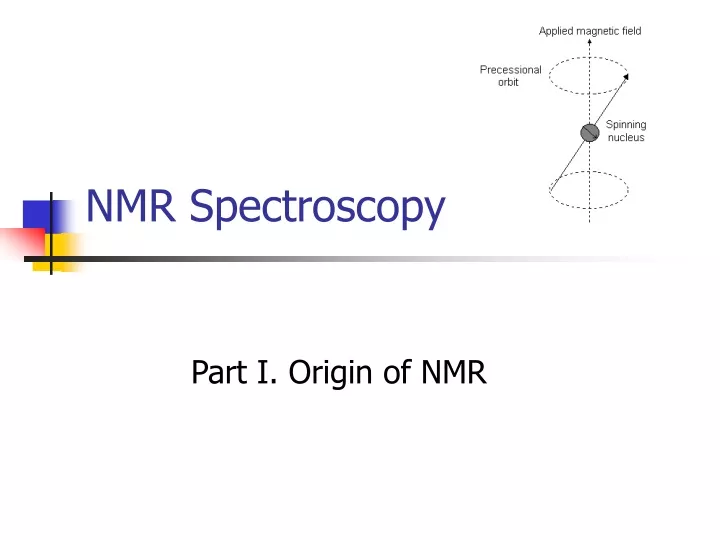
NMR Spectroscopy Part I. Origin of NMR
Nuclei in Magnetic Field • Nucleus rotate about an axis -- spin Nucleus bears a charge, its spin gives rise to a magnetic field . The resulting magnetic moment is oriented along the axis of spin and is proportional to angular momentum m = g p • : magnetic moment p: angular momentum g: magnetogyric ratio
Nuclei in Magnetic Field • Spin Quantum Number I a characteristic property of a nucleus. May be an integer or half integer # of protons # of neutrons I even even 0 odd odd integer 1,2,3… even even half integral odd odd half integral
Nuclei in Magnetic Field • Properties of nucleus with spin quantum number I 1. An angular momentum of magnitude {I(I+1)}1/2ħ 2.A component of angular momentum mIħ on an arbitrary axis where mI=I, I-1, … -I (magnetic quantum number) 3. When I>0, a magnetic moment with a constant magnitude and an orientation that is determined by the value of mI. m = g mI ħ
Nuclei in Magnetic Field • In a magnetic field B(in z direction) there are 2I+1 orientations of nucleus with different energies. B0: magnetic field in z direction nL: Larmor Frequency
Nuclei in Magnetic Field • For I=1/2 nucleus : mI = 1/2 and –1/2
Nuclei in Magnetic Field Distribution between two states
Nuclei in Magnetic Field Magnetizaton The difference in populations of the two states can be considered as a surplus in the lower energy state according to the Boltzmann distribution A net magnetization of the sample is stationary and aligned along the z axis (applied field direction)
Nuclei in Magnetic Field Two spins All spins Sum Ho parallel anti-parallel Bulk Magnetization excess facing down
Effect of a radio frequency p 1. equilibrium DE ap H1 hn = DE hn = DE 4. release energy (detect) 2. pump in energy p p 5. equilibrium 3. non-equilibrium ap ap
Relaxation- Return to Equilibrium t t x,y plane z axis 0 0 Longitudinal Transverse 1 1 t t 2 2 E-t/T2 1-e-t/T1 8 8 Transverse always faster!
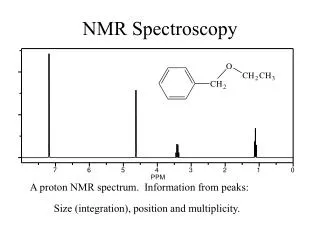
NMR Spectroscopy Part II. Signals of NMR
Free Induction Decay (FID) • FID represents the time-domain response of the spin system following application of an radio-frequency pulse. • With one magnetization at w0, receiver coil would see exponentially decaying signal. This decay is due to relaxation.
Fourier Transform The Fourier transform relates the time-domainf(t) data with the frequency-domainf(w) data.
NMR line shape Lorentzian line A amplitude W half-line width
Resolution • Definition For signals in frequency domain it is the deviation of the peak line-shape from standard Lorentzian peak. For time domain signal, it is the deviation of FID from exponential decay. Resolution of NMR peaks is represented by the half-height width in Hz.
Resolution • Measurement half-height width: 10~15% solution of 0-dichlorobenzene (ODCB) in acetone Line-shape: Chloroform in acetone
Resolution • Factors affect resolution Relaxation process of the observed nucleus Stability of B0(shimming and deuterium locking) Probe (sample coil should be very close to the sample) Sample properties and its conditions
Sensitivity • Definition signal to noise-ratio A : height of the chosen peak Npp : peak to peak noise
Sensitivity • Measurement 1H 0.1% ethyl benzene in deuterochloroform 13C ASTM, mixture of 60% by volume deuterobenzene and dioxan or 10% ethyl benzene in chloroform 31P 1% trimehylphosphite in deuterobenzene 15N 90% dimethylformamide in deutero-dimethyl- sulphoxide 19F 0.1% trifluoroethanol in deuteroacetone 2H, 17O tap water
Sensitivity • Factors affect sensitivity Probe: tuning, matching, size Dynamic range and ADC resolution Solubility of the sample in the chosen solvent
Spectral Parameters • Chemical Shift Caused by the magnetic shielding of the nuclei by their surroundings. d-values give the position of the signal relative to a reference compound signal. • Spin-spin Coupling The interaction between neighboring nuclear dipoles leads to a fine structure. The strength of this interaction is defined as spin-spin coupling constant J. • Intensity of the signal
Chemical Shift • Origin of chemical shift • sshielding constant • Chemically non-equivalent nuclei are shielded to different extents and give separate resonance signals in the spectrum
Chemical Shift • d – scale or abscissa scale
Chemical Shift Shielding s CH3Br < CH2Br2 < CH3Br < TMS 90 MHz spectrum
Chemical Shift • d is dimensionless expressed as the relative shift in parts per million ( ppm ). • d is independent of the magnetic field • d of proton 0 ~ 13 ppm d of carbon-13 0 ~ 220 ppm d of F-19 0 ~ 800 ppm d of P-31 0 ~ 300 ppm
Chemical Shift • Charge density • Neighboring group Anisotropy Ring current Electric field effect Intermolecular interaction (H-bonding & solvent)
Chemical Shift –anisotropy of neighboring group c susceptibility r distance to the dipole’s center Differential shielding of HA and HB in the dipolar field of a magnetically anisotropic neighboring group
Chemical Shift –anisotropy of neighboring group d~2.88 d~9-10
Electronegative groups are "deshielding" and tend to move NMR signals from neighboring protons further "downfield" (to higher ppm values). • Protons on oxygen or nitrogen have highly variable chemical shifts which are sensitive to concentration, solvent, temperature, etc. • The -system of alkenes, aromatic compounds and carbonyls strongly deshield attached protons and move them "downfield" to higher ppm values.
Electronegative groups are "deshielding" and tend to move NMR signals from attached carbons further "downfield" (to higher ppm values). • The -system of alkenes, aromatic compounds and carbonyls strongly deshield C nuclei and move them "downfield" to higher ppm values. • Carbonyl carbons are strongly deshielded and occur at very high ppm values. Within this group, carboxylic acids and esters tend to have the smaller values, while ketones and aldehydes have values 200.
Ring Current • The ring current is induced form the delocalized p electron in a magnetic field and generates an additional magnetic field. In the center of the arene ring this induced field in in the opposite direction t the external magnetic field.