Download
1 / 77
810 likes | 1.01k Vues
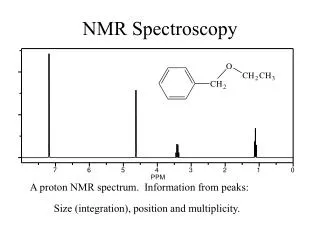
NMR Spectroscopy. CHEM 430. Proton-Proton Correlation Through J-Coupling. 2D NMR Basics. In actuality, the techniques we have already covered 1 H, 13 C, and DEPT are 2-D (frequency vs. intensity) however, by tradition the intensity component is dropped when discussing dimensionality

E N D
NMR Spectroscopy CHEM 430
Proton-Proton Correlation Through J-Coupling 2D NMR Basics. • In actuality, the techniques we have already covered 1H, 13C, and DEPT are 2-D (frequency vs. intensity) however, by tradition the intensity component is dropped when discussing dimensionality • In 2-D techniques, many FIDs (proto-NMR spectra) are taken one after another, with some acquisition variable or pulse sequenced varied by small increments • Since each FID is a collection of digitized data points in the first dimension (say 10 points to make a spectrum) if 10 spectra are accumulated with an incremental change in variable, an FT can be performed in the other dimension 1-D FID . . . . . . . . . . . . . . . . . . . . . . . . . . . . . . . . . . . . . . . . . . . . . . . . . . . . . . . . . . . . . . . . . . . . . . . . . . . . . . . . . . . . . . . . . . . . . . . . . . . . . . . . . . . . . . . . . . . . . . . . . . . . . . . . . . . . . . . . . . . . . . . . . . . . . . . . . . . . . . . . . . . . . . . . . . . . . . . . . . . . . . . . . . . . . . . . . . . . . . . . FTs can be performed on the vertical data sets 1-D spectra, each with an incremental variable change CHEM 430 – NMR Spectroscopy
Proton-Proton Correlation Through J-Coupling 2D NMR Basics. • The first perturbation of the system (pulse) is called the preparation of the spin system. • The effects of this pulse are allowed to coalesce; this is known as the evolution time, t1 (NOT T1 – the relaxation time) • During this time, a mixing event, in which information from one part of the spin system is relayed to other parts, occurs • Finally, an acquisition period (t2) as with all 1-D experiments. Preparation Evolution Mixing Acquisition t1 t2 CHEM 430 – NMR Spectroscopy
Proton-Proton Correlation Through J-Coupling 2D COSY. • H-H COrrelationSpectroscopY (COSY): • The pulse sequence for COSY is as follows: • A 90o pulse in the x-direction is what we used for 1-D 1H NMR • Here, after a variable “mixing” period, a second 90opulse is performed, followed by acquisition of a spectrum 90x 90x t2 t1 CHEM 430 – NMR Spectroscopy
Proton-Proton Correlation Through J-Coupling 2D COSY. • Consider a simple spectrum with one resonance (CHCl3): B0 z M y x CHEM 430 – NMR Spectroscopy
Proton-Proton Correlation Through J-Coupling 2D COSY. • We pulse the sample with our standard 90ox tilting magnetization into y B0 z 90x M y x CHEM 430 – NMR Spectroscopy
Proton-Proton Correlation Through J-Coupling 2D COSY. • After a short time t the vector begins to evolve around the z-axis B0 z 90x y M x CHEM 430 – NMR Spectroscopy
Proton-Proton Correlation Through J-Coupling 2D COSY. • This vector now has an x-component and y-component B0 z 90x t1 Mcoswt1 y Msinwt1 M x CHEM 430 – NMR Spectroscopy
Proton-Proton Correlation Through J-Coupling 2D COSY. • If a 90ox pulse is applied again only the y component is rotated to -z B0 z 90x 90x t1 y Msinwt1 Mcoswt1 x M CHEM 430 – NMR Spectroscopy
Proton-Proton Correlation Through J-Coupling 2D COSY. • If we now detect in the xy plane, only the x-component remains B0 z 90x 90x t2 t1 Signal: y Msinwt1 Mx x 7.0 CHEM 430 – NMR Spectroscopy
Proton-Proton Correlation Through J-Coupling 2D COSY. • Repeat the experiment, but let time evolve by a longer increment B0 z 90x y M x CHEM 430 – NMR Spectroscopy
Proton-Proton Correlation Through J-Coupling 2D COSY. • This vector now has a greater x-component than before B0 z 90x t1 Mcoswt1 y Msinwt1 M x CHEM 430 – NMR Spectroscopy
Proton-Proton Correlation Through J-Coupling 2D COSY. • If a 90ox pulse is applied again only the y component is rotated to -z B0 z 90x 90x t1 y Msinwt1 Mcoswt1 x M CHEM 430 – NMR Spectroscopy
Proton-Proton Correlation Through J-Coupling 2D COSY. • Now we will detect a larger x-component than before B0 z 90x 90x t2 t1 Signal: y Msinwt1 Mx x 7.0 CHEM 430 – NMR Spectroscopy
Proton-Proton Correlation Through J-Coupling 2D COSY. • In the COSY experiment a new ‘spectrum’ is acquired at increments of t1 • If we stack the array of spectra evolving at t1 increments, notice how we now have a new FID of sorts in the orthogonal coordinate! CHEM 430 – NMR Spectroscopy
Proton-Proton Correlation Through J-Coupling 2D COSY. • If we carry out a Fourier Transform in this other coordinate, we generate a 2-D spectrum where the CHCl3 peak shows up at 7.27 on both axes. • The peak is more a sharp cone in shape FT CHEM 430 – NMR Spectroscopy
Proton-Proton Correlation Through J-Coupling 2D COSY. • Now let’s make this more complex; but what occurs now is a simplification! B0 z M y x CHEM 430 – NMR Spectroscopy
Proton-Proton Correlation Through J-Coupling 2D COSY. • Let’s pulse a sample with two nuclei that are spin coupled. B0 z 90x M y x CHEM 430 – NMR Spectroscopy
Proton-Proton Correlation Through J-Coupling 2D COSY. • By T2 relaxation vector begins to diverges as +J/2 and –J/2 B0 B0 z z y y M M x x CHEM 430 – NMR Spectroscopy
Proton-Proton Correlation Through J-Coupling 2D COSY. • The two nuclei are precessing at different w and decaying at different T1 BUT they share a frequency of oscillation of resultant x-component about the z-axis!!! z z y y M M x x CHEM 430 – NMR Spectroscopy
Proton-Proton Correlation Through J-Coupling 2D COSY. • So in the 1st dimension, the spectra appear “normal”, but in the second dimension these two nuclei share a oscillation frequency of x-component • If we stack the spectra we see that they show an artifact of related spin at the frequency of their coupling partner • Rather than view the 3-D map, it is customary to interperet the 2-D spectrum as viewing from overhead CHEM 430 – NMR Spectroscopy
Proton-Proton Correlation Through J-Coupling 2D COSY. • Also keep in mind that J values have a sign and the vectors they generate have a – and + component, so in reality: f1 f2 CHEM 430 – NMR Spectroscopy
Proton-Proton Correlation Through J-Coupling How to use 2D COSY. • Consider the COSY spectrum of butyl propanoate • Remember all resonances share their own variation of x-component in the COSY experiment. • The peaks along the diagonal in the COSY spectrum show this relationship and can be ignored. CHEM 430 – NMR Spectroscopy
Proton-Proton Correlation Through J-Coupling How to use 2D COSY. • The ‘normal’ 1-D 1H spectrum is placed on the F1 and F2 axes as a reference. • This spectrum is obtained separately! CHEM 430 – NMR Spectroscopy
Proton-Proton Correlation Through J-Coupling How to use 2D COSY. • To find a pair of coupling partners simply find the cross peak relationships • For example the resonance at d 4.05 we can identify by chemical shift as being adjacent to the sp3 oxygen of the ester. • We find it is coupled to the resonance at d 1.65 CHEM 430 – NMR Spectroscopy
Proton-Proton Correlation Through J-Coupling How to use 2D COSY. • We now use the d 1.65 resonance to find the next coupling partner • We see it is coupled to the adjacent resonance at d1.4 • Likewise the d 1.4 resonance is coupled to the resonance at d 0.95 • This resonance only has the d 1.4 as a coupling partner, so the chain ends. CHEM 430 – NMR Spectroscopy
Proton-Proton Correlation Through J-Coupling How to use 2D COSY. • Likewise we can deduce the ethyl chain attached to C=O as a separate coupled family • The only drawback of the COSY experiment is it cannot ‘see through’ parts of the molecule that have no 1H-1H coupling (2JHH or 3JHH) • These include 4o carbons, C=O, 3o amines, -O-, -S-, etc. CHEM 430 – NMR Spectroscopy
Proton-Proton Correlation Through J-Coupling DQFCOSY. • Double quantum filtered - an extra pulse is added after the second COSY pulse, and phase cycling converts multiple quantum coherences into observable magnetizations. • The resulting 2D spectrum lacks all singlets along the diagonal • The experiment has surplanted the COSY-45 in the text CHEM 430 – NMR Spectroscopy
Proton-Proton Correlation Through J-Coupling DQFCOSY. • An important feature of the experiment is that double quantum filtration allows both diagonal and cross peaks to be tuned into pure absorption at the same time. • This reduces the size of all diagonal signals and permits cross peaks close to the diagonal to be observed. • The only disadvantage of DQF– COSY is a reduction in sensitivity CHEM 430 – NMR Spectroscopy
Proton-Heteronucleus Correlation HETCOR. • The 13C-1H COSY (HETeronuclearCORrelation) experiment correlates 13C with directly attached 1H via 1JCH couplings. • Since the frequency domains F1 and F2 are for different nuclei we do not observe diagonal peaks as in 1H-1H COSY • During the evolution time the large 1JCH is used for polarization transfer, so only 13C directly bound to 1H are detected CHEM 430 – NMR Spectroscopy
Proton-Heteronucleus Correlation HETCOR. • Note how we can now determine that two protons are on the same carbon: CHEM 430 – NMR Spectroscopy
Proton-Heteronucleus Correlation HETCOR. • The principle disadvantage of HETCOR is total acquisition time. Typically 5-8 times the length of the corresponding 13C experiment. CHEM 430 – NMR Spectroscopy
Proton-Heteronucleus Correlation HSQC/HMQC. • One way around the sensitivity problem with HETCOR is to observe the 1H in the 13C-1H system and study 1JHC rather than the non-abundant 13C. • The 2D HSQC (Heteronuclear Single-Quantum Correlation) experiment permits to obtain a 2D heteronuclear chemical shift correlation map between directly-bonded 1H and X-heteronuclei (commonly, 13C and 15N). • One interesting artifact of the HSQC experiment is the ability to create a low-resolution 1-D 13C spectrum from the 2-D data! CHEM 430 – NMR Spectroscopy
Proton-Heteronucleus Correlation HSQC/HMQC. • The data is interpreted like HETCOR; the 13C spectrum on the F1 axis is acquired separately and actually takes longer than the 2D acquisition! CHEM 430 – NMR Spectroscopy
Proton-Heteronucleus Correlation HMBC. • The 2D HMBC experiment permits to obtain a 2D heteronuclearchemical shift correlation map between long-range coupled 1H and heteronuclei (commonly, 13C). • It is widely used because it is based on 1H-detection, offering high sensitivity when compared with the 13C-detected. • In addition, long-range proton-carbon coupling constants can be measured from the resulting spectra. CHEM 430 – NMR Spectroscopy
Proton-Heteronucleus Correlation HMBC. • The power of this technique is it allows us to “see” through a quarternary carbon center! • The drawback is that for small molecules with tight ring or fused-ring systems (like many of the unknowns) everything may be correlated to everything else! CHEM 430 – NMR Spectroscopy
Proton-Heteronucleus Correlation HMBC. • In this example we see ipsenol and each of the ‘5-C domains’ that make up the molecule. • For example C-4 is within 3JHC of H-3, H-3’, H-2, OH, H-5 and H-5’ • C-7 can be seen to be within 3 bonds of 5/5’ through the 4o center at C-6! CHEM 430 – NMR Spectroscopy
Problems - 1 CHEM 430 – NMR Spectroscopy
Problems - 1 CHEM 430 – NMR Spectroscopy
Problems - 1 CHEM 430 – NMR Spectroscopy
Problems - 1 CHEM 430 – NMR Spectroscopy
Problems - 1 CHEM 430 – NMR Spectroscopy
Problems - 2 CHEM 430 – NMR Spectroscopy
Problems - 2 CHEM 430 – NMR Spectroscopy
Problems - 2 CHEM 430 – NMR Spectroscopy
Problems - 2 CHEM 430 – NMR Spectroscopy
Problems – 2 - HSQC CHEM 430 – NMR Spectroscopy
Problems - 3 CHEM 430 – NMR Spectroscopy
Problems - 3 CHEM 430 – NMR Spectroscopy
Problems - 3 CHEM 430 – NMR Spectroscopy